| Issue |
A&A
Volume 641, September 2020
|
|
|---|---|---|
| Article Number | A162 | |
| Number of page(s) | 11 | |
| Section | Extragalactic astronomy | |
| DOI | https://doi.org/10.1051/0004-6361/201937407 | |
| Published online | 24 September 2020 | |
Water megamaser emission in hard X-ray selected AGN⋆
1
Istituto di Astrofisica e Planetologia Spaziali di Roma (IAPS-INAF), Via del Fosso del Cavaliere 100, 00133 Roma, Italy
e-mail: This email address is being protected from spambots. You need JavaScript enabled to view it.
2
Osservatorio Astronomico di Cagliari (OAC-INAF), Via della Scienza 5, 09047 Selargius (CA), Italy
3
Osservatorio di Astrofisica e Scienza dello Spazio di Bologna (OAS-INAF), Via P. Gobetti 101, 40129 Bologna, Italy
Received:
23
December
2019
Accepted:
12
June
2020
Abstract
Context. Water megamaser emission at 22 GHz has proven to be a powerful tool for astrophysical studies of active galactic nuclei (AGN) because it allows an accurate determination of the mass of the central black hole and of the accretion disc geometry and dynamics. However, after searches among thousands of galaxies, only about 200 of them have shown such spectroscopic features, most of them of uncertain classification. In addition, the physical and geometrical conditions under which a maser activates are still unknown.
Aims. We characterize the occurrence of water maser emission in an unbiased sample of AGN by investigating the relation with the X-ray properties and the possible favourable geometry that is required to detect water maser.
Methods. We searched for 22 GHz maser emission in a hard X-ray selected sample of AGN, taken from the INTEGRAL/IBIS survey above 20 keV. Only half of the 380 sources in the sample have water maser data. We also considered a volume-limited sub-sample of 87 sources, for which we obtained new observations with the Green Bank and Effelsberg telescopes (for 35 sources). We detected one new maser and increased its radio coverage to 75%.
Results. The detection rate of water maser emission in the total sample is 15 ± 3%. This fraction increases to 19 ± 5% for the complete sub-sample, especially when we consider type 2 (22 ± 5% and 31 ± 10% for the total and complete samples, respectively) and Compton-thick AGN (56 ± 18% and 50 ± 35% for the total and complete samples, respectively). No correlation is found between water maser and X-ray luminosity. We note that all types of masers (disc and jet) are associated with hard X-ray selected AGN.
Conclusions. These results demonstrate that the hard X–ray selection may significantly enhance the maser detection efficiency over comparably large optical or infrared surveys. A possible decline in detection fraction with increasing luminosity might suggest that an extremely luminous nuclear environment does not favour maser emission. The large fraction of CT AGN with water maser emission could be explained in terms of geometrical effects. The maser medium would then be the very edge-on portion of the obscuring medium.
Key words: galaxies: active / galaxies: Seyfert / masers / X-rays: galaxies / gamma rays: galaxies / surveys
Table A.1 is only available at the CDS via anonymous ftp to cdsarc.u-strasbg.fr (130.79.128.5) or via http://cdsarc.u-strasbg.fr/viz-bin/cat/J/A+A/641/A162
© ESO 2020
1. Introduction
One of the most common maser emission lines arises from the water rotational transition levels 616 and 523, which emit at 22 GHz in the radio domain. Extra-galactic water masers trace warm (Tkin > 300 K) and dense (107 cm−3 < n(H2) < 1011 cm−3) gas (Elitzur 1992; Neufeld et al. 1994). Water maser sources with an isotropic luminosity below 10 L⊙ are defined as kilo-masers, while at higher luminosity, they are defined as mega-masers. The latter are generally associated with the activity of active galactic nuclei (AGN), while kilo-masers are more commonly related to star formation in the host galaxy (this distinction should, however, be used with caution, see Sect. 4.2 in Tarchi et al. 2011a and this work Sect. 3).
The activity of water maser emission in AGN has been associated with three main different phenomena (see e.g. Lo 2005; Tarchi 2012). A typical triple-peak system of lines is associated with an accretion disc emission (one systemic, one blueshifted, and one redshifted), whose geometry and rotation velocities can be traced by very long baseline interferometry (VLBI, e.g. Miyoshi et al. 1995; Greenhill et al. 2003a). On the other hand, the interaction between the radio jet and the molecular clouds or the overlap along the line of sight between the molecular cloud and radio continuum emission from the jet might produce water maser emission in the form of a single broad redshifted (or blueshifted) line (e.g. Gallimore et al. 2001, 1996; Henkel et al. 2005). Jet velocity and density were estimated in a reverberation mapping analysis (Peck et al. 2003). Finally, in the case of the Circinus galaxy, the water maser emission has shown two different dynamic components in VLBI mapping: one associated with a warped disc, and another with a wide-angle nuclear outflow (Greenhill et al. 2003a). Outflowing maser components have also been detected in NGC 3079 (Kondratko et al. 2005).
So far, more than 4000 galaxies have been searched for water maser emission, and detections have been obtained in about 160 of them (180 when starburst galaxies are also included; Megamaser Cosmology Project, MCP1), the majority are radio-quiet AGN in the local Universe (z ≤ 0.05), classified as Seyfert 2 or low-ionisation nuclear emission-line regions (LINERs). The overall detection rate in large maser surveys is rather low (e.g. Braatz et al. 1997; Greenhill et al. 2003a; van den Bosch et al. 2016) and is about 3% for sources observed within the MCP, which mainly targets galaxies selected from large optical surveys, such as SDSS, 6dF, and 2MRS (Braatz et al. 2015; see also Greenhill et al. 2003b; Zhu et al. 2011). Hagiwara et al. (2002, 2003) selected their targets based on the ratio of radio continuum to IR (60 μ and 100 μ) flux densities from IRAS galaxies and obtained a slightly higher detection rate of 8%. Henkel et al. (2005) later confirmed that the far-IR selection favours maser detection. These authors found a detection rate of 22% in a sample of northern galaxies with an IRAS point source flux density at 100 micron greater than 50 mJy. More recently, Kuo et al. (2018) found that galaxies with water maser detection tend to be associated with strong IR emission, as observed by the WISE telescope, thus offering a way to boost the detection rate to 6–15%. It has also been suggested that radio emission is a suitable indicator for water maser emission (Zhang et al. 2012, 2017), and the radio luminosities of maser galaxies indeed tend to be higher by a factor of 2–3 than those in non-masing galaxies (Liu et al. 2017).
Finally, the fraction of water maser detection has been found to be around 26% in a sample of Seyfert galaxies located within 20 Mpc. This suggests that an observational bias in terms of distance is also likely (Panessa & Giroletti 2013).
The maser detection efficiency might be improved if high-luminosity objects were selected (Zhu et al. 2011). However, the largest fraction of nuclear water masers seems to be associated with type 2 Seyfert galaxies and a high level of X-ray obscuration (Greenhill et al. 2008), in particular to Compton-thick AGN (CT AGN are defined as sources with an X-ray obscuration of NH > 1024 cm−2. This is the inverse of the Thomson cross section) (Greenhill et al. 2003b; Castangia et al. 2019). This is in line with the predictions of unified models for AGN (Antonucci & Miller 1985), in which an obscuring torus that is aligned with the accretion disc at larger scales is responsible for the observed obscuration and for the optical classification of the AGN (see Padovani et al. 2017 for a review). Interestingly, the fraction of CT obscuration increases in disc masers (Greenhill et al. 2008), as was confirmed by X-ray studies of known disc masers (Castangia et al. 2013; Masini et al. 2016). In order to be detected, maser discs should be observed nearly edge-on to the observer line of sight. This suggest that the X–ray obscuring material and the maser disc are connected. Masers might indeed trace molecular material associated with the torus or the outer regions of the accretion disc. All the different proposed geometries (Elitzur & Shlosman 2006; Tilak et al. 2008; Masini et al. 2016) take into account that long path lengths are needed to produce maser amplification, therefore the observer line of sight has to be close to an edge-on orientation. In this respect, warped discs, as have been observed in the prototype NGC 4258 (Herrnstein et al. 1997), increase the probability that the line of sight is intercepted. The disc has to be warped to be directly illuminated by the X-ray radiation from the central engine, as envisaged by the theory of maser production (Neufeld et al. 1994). More recently, Darling (2017) discussed the interesting possibility that some water maser sources might be detected that are associated with inclined accretion discs (more than 10 degrees from edge-on) and orbit massive black holes. The detection would be made by the lensing or deflection of in-going systemic maser features.
Even though objects with higher X-ray luminosity and/or higher column density more likely host masers, there is no large sample of AGN with X-ray data available so far for a target selection, nor has a similar type of study been performed on a statistically meaningful basis. This work aims at filling this gap and at providing some useful means to improve the maser detection efficiency by pre-selecting targets from hard X-ray surveys, which so far are the least biased in terms of intrinsic AGN absorption.
Throughout this paper we assume a flat Λ cold dark matter cosmology with (ΩM, ΩΛ) = (0.3,0.7) and a Hubble constant of 70 km s−1 Mpc−1 (Jarosik et al. 2011).
2. Sample definition
We concentrate on a sample of active galaxies selected in hard X-rays (or soft gamma-ray band, defined above 20 keV). This waveband provides a very efficient way to find nearby AGN (unabsorbed and absorbed) because it is transparent to obscured regions or objects, that is, those that might be missed at other frequencies such as optical, UV, and even X-rays below 10 keV. Since 2002, the hard X–ray sky is being surveyed by INTEGRAL/IBIS (Ubertini et al. 2003) and subsequently by Swift/BAT (Gehrels et al. 2004) at energies greater than ∼20 keV; various all-sky catalogues have been released based on the data collected by these two satellites (see e.g. Bird et al. 2016; Baumgartner et al. 2013; Oh 2018). These catalogues contain large fractions of active galaxies, about 40% of the INTEGRAL/IBIS and up to 70% of the Swift/BAT sources. These two samples together provide the most extensive list of hard X-ray selected active galaxies known to date.
For the purpose of this work, we used the large sample of AGN extracted from INTEGRAL/IBIS data. For comparison purposes alone, we consulted two samples extracted from Swift/BAT surveys (the 9-month and 70-month samples).
For INTEGRAL, we considered the sample of 272 AGN discussed by Malizia et al. (2012), to which we added 108 sources that have been discovered or identified with active galaxies afterwards (Malizia et al. 2016). This set of 380 hard X-ray selected AGN represents our reference catalogue and was used as the main input for this work. The main advantage of this sample is that it is fully characterised in terms of optical class, redshift, and X-ray properties, including information on the X-ray and hard X-ray fluxes and X-ray column density. Unfortunately, due to the INTEGRAL observing strategy, this sample is not complete or uniform, and to overcome this limitation, we considered a subset of AGN (all included in the sample of 380 objects) that instead represent a complete sample. This sample, which is fully discussed in Malizia et al. (2009), consists of 87 galaxies that are detected in the 20–40 keV band and listed in the thirrd IBIS survey (Bird et al. 2007). We note that one source, IGR J03184-0014, is not considered here as it was never again detected in subsequent INTEGRAL surveys. To investigate maser emission in the entire sample of 380 AGN, we consulted the catalogues maintained on the website of the MCP, which is the largest and most comprehensive catalogue of all galaxies that have been surveyed for water maser emission at 22 GHz (Reid et al. 2009; Braatz et al. 2010). The catalogue has been updated on a regular basis to include all of the new observations and associated findings. To integrate the MCP data and to cover our sample as far as possible, we also searched the literature for reports of water maser observations or detections. Finally, 35 galaxies belonging to the complete sample were observed for the first time in search for 22 GHz water maser emission using the Effelsberg telescope and the Green Bank Telescope (GBT). We discovered new maser (Sect. 3). Table A.1 lists all 380 INTEGRAL/IBIS AGN (see Appendix A for a detailed description).
In Fig. 1 we plot the hard X-ray luminosity as a function of redshift (in logarithmic scale) for the total sample (left panel) and the complete sample (right panel). We divide the AGN into those that are not observed at 22 GHz, those that are observed, and those that are detected. This figure clearly shows that objects at high redshift and high hard X-ray luminosity are almost not covered by maser observations. Furthermore, we compared the redshift and luminosity distributions of the total and complete samples in order to confirm whether they belong to the same parent population (null hypothesis). A Kolmogorov–Smirnov (KS) test results in p-values of 0.10 (z) and 0.59 (L20 − 100 keV), therefore the null hypothesis cannot be rejected at the 1% level. This suggests that the two samples might be considered statistically equivalent, that is, likely affected by similar biases. We performed the same test and only considered the observed sources in the two samples. The KS test results in p-values of 0.75 (z) and 0.41 (L20 − 100 keV), and again, the null hypothesis cannot be rejected at the 1% level. We conclude that the total and complete samples of hard X-ray selected AGN with water maser observations are representative of the local Universe and thus constitute an ideal set in which to study water maser occurrence in nearby super-massive black holes.
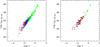 |
Fig. 1. Hard X-ray luminosity (20–100 keV) vs. redshift logarithm. Green dots represent the sources that are not observed at 22 GHz, blue stars are observed sources, and red open polygons are detected sources. Left panel: total sample of 380 AGN. Right panel: complete sub-sample of 87 AGN. |
3. Observations, data reduction, and results
3.1. GBT observations
We observed the 616–523 transition of ortho-H2O (rest frequency 22.23508 GHz) towards 28 galaxies of the complete INTEGRAL sample with the GBT between March 2010 and January 2011 (projects AGBT10A-042 and AGBT10C-012). We used the 18–22 GHz dual-beam receiver in nod mode and kept one of the two beams alternately on-source during integration. The GBT spectrometer was configured with two 200 MHz IFs offset by 180 MHz for a total coverage of 380 MHz (corresponding to 5100 km s−1 at 22 GHz). The first spectral window was centred at the frequency corresponding to the recessional velocity of each galaxy, and the second was offset to the red. This setup yielded a channel spacing of 24 kHz (∼0.3 km s−1 at 22 GHz) per spectral window. We reduced and analysed the data with GBTIDL2. Flux calibration was performed using standard routines and applying the default zenith opacity and gain curve. The estimated uncertainty of the absolute flux calibration is ∼20% (for details, see the guide for calibrating GBT spectral line data using GBTIDL3).
3.2. Effelsberg observations
On April 15 and 16, 2011, we used the Effelsberg 100 m telescope to search for 22 GHz water maser emission in seven galaxies of the complete INTEGRAL sample (3C 111, IC 4329A, IGR J16482, 2E 1739, IGR J17513, IGR J21247, and BL LAC). We employed the 1.3 cm primary focus (PFK) receiver (17.9–26.2 GHz) with a fast Fourier transform (FFT) spectrometer encompassing 100 MHz and 16384 channels. This setup yielded a channel spacing of 6.1 kHz, corresponding to 0.08 km s−1 at 22.2 GHz. We observed in position-switching mode, with the off-position offset by 15 arcmin in right ascension. Signals from individual on- and off-source positions were integrated for 120 s each. The data were reduced using the GILDAS software package (e.g. Guilloteau & Lucas 2000). To convert the measured signal from counts into antenna temperature, we used the tabulated values of the noise diode in K. We then applied the normalised gain curve and multiplied by the standard value of the sensitivity4. The uncertainty of this flux calibration was derived by applying the same procedure to continuum-pointing scans of NGC 7027, and it is estimated to be ∼30%.
3.3. Results
During our survey, a new water maser was detected with the GBT in the narrow line Seyfert 1 (NLSy1) galaxy IGR J16385-2057 on March 28, 2010. This discovery, and hence the line profile and the characteristics of the water maser emission, has been anticipated in a previous paper by our team, which was focused on water maser emission in NLSy1 galaxies (Tarchi et al. 2011b). Here, we report in Table A.1 the isotropic line luminosity. In Table A.1 we also list the 1σ rms and the upper limit on LH2O for the remaining 33 targets, with the exception of 3C 273. The strong radio continuum emission of the blazar jet (S22 = 27–43 Jy, e.g. Gear et al. 1994) affects the GBT spectral baseline, which is visible as strong ripples. These prevented us from estimating a reliable rms for this source and from assessing the presence (or absence) of an emission line. As a consequence, 3C 273 is labelled “not observed” in Table A.1.
Although we were unable to reach the full coverage of the complete sample at 22 GHz, we were able to increase the number of sources with water maser observations from the initial 31 with data in the literature to 65 (34 from our own survey). This increases the coverage from 36% to 75%.
Within the sample of 34 objects that were observed for the first time, the maser detection rate is rather low (1 of 34, or < 6%), but this is likely due to the optical classification of the observed sources: most objects (26) belong to the type 1 classification, and only 8 sources are of type 2. The one detected maser belongs to the class of NLSy1, which indeed seems to have a high probability of hosting maser emission (Tarchi et al. 2011b). In this respect, the fraction of detected maser within these newly observed AGN is consistent with the average fraction of detected masers in type 1 objects (see next section). We also searched for further biases that might be introduced by the lack of full radio observation coverage of the complete sample in addition to the known bias against high redshift and luminosity. We compared the distribution of X-ray absorption and position in the sky of the observed and unobserved sources. The test did not reveal significant differences between the two sub-samples in terms of absorption (KS p-value = 0.09) or position in the sky (KS p-value = 0.23).
4. Maser fraction at high energies
Out of 380 objects in the total sample, 193 have been observed at 22 GHz. This is only 51 ± 4% of the sample. In the complete sample, 65 out of 87 objects were observed at this frequency. This provides a coverage of almost 75%.
Considering the total set of INTEGRAL AGN reported in Table A.1, we found that out of 193 galaxies observed at 22 GHz, 29 have been reported as maser sources; this represents a detection rate of 15 ± 3%. Errors on the fractions were calculated as  , where NM is the number of detected maser sources and NO is the number of observed sources. To take unobserved sources into account and thus provide a range of values for the entire sample, we can take two extreme approaches and assume that if pointed, all not yet observed INTEGRAL AGN are found to be undetected at 22 GHz (lower range), or alternatively, that all are detected (upper range). Under these conditions, we find that the detection rate for the whole sample ranges from 8 to 57%. This a rather wide range that nevertheless tells us that the detection rate in the worst case is higher than is generally obtained using large samples of optically selected galaxies (Sect. 1). Out of 29 objects with maser detection, the 22 GHz luminosity is below 10 L⊙ for 6 objects (i.e. Mkn 3, NGC 4051, NGC 4151, Mkn 766, Cen A, and NGC 6300) and they therefore qualify to be kilo-maser objects. However, some of these sources were imaged at high resolution and their maser emission was found to be located within the nuclear region of the host galaxies. Therefore, given that all our sources are hard X–ray emitters and can confidently be associated with an accreting supermassive black hole, we confirm that kilo-maser emission may not only be associated with star formation, but also with AGN activity, as has been suggested by Tarchi et al. (2011a).
When we instead consider the complete sample of INTEGRAL sources that is highlighted in Table A.1, 65 AGN are observed at 22 GHz, of which 12 are detected and only 22 are unobserved. In this case, the detection rate is 19 ± 5% and the range of possible values lies between 14 and 39%.
Because water maser emitters show a preference to be found in type 2 AGN, we also restricted our analysis to Seyfert 2 galaxies alone (including intermediate types 1.8–1.9), which are present either in the total or in the complete INTEGRAL samples. In this case, we find that the sample coverage was 68% (103 AGN observed, 23 detected, and 60 unobserved) and 88% (29 AGN observed, 9 detected, and 5 unobserved) for the total and complete sample, respectively: we therefore estimate a detection rate of 22 ± 5% (range values from 14 to 51%) and 31 ± 10% (range values from 27 to 41%) for each of these two samples.
These fractions are even more remarkable when they are compared to those of Seyfert 1 (in this case, also including intermediate types 1.2–1.5): 74 objects have water maser observations of the type 1 AGN, but only two (NGC 4151 and NGC 3783) have been detected. This implies a detection fraction of about 3%, which is similar to what we found within the MCP (see also König et al. 2012). Interestingly, the detection rate of NLSy1, which are also broad-line AGN but have peculiar characteristics at multi-frequencies with respect to standard broad line AGN (see e.g. Panessa et al. 2011), is comparable to those of Seyfert 2. Our sample includes 9 NLSy1 with 22 GHz measurements and 3 water maser detections (NGC 4051, Mkn 766, and IGR J16385-2057), which implies rates close to 30%. This confirms previous results obtained by Tarchi et al. (2011b) in a dedicated study of this type of AGN, in which the authors suggested an outflow origin for water maser emission. Mathur (2000) proposed that NLSy1 sources might be young AGN residing in rejuvenated galaxies; alternatively, their peculiarities might be explained in terms of an orientation effect that is caused by the pole-on observation of their broad-line region (Decarli et al. 2008). The link of these two interpretations to the maser phenomenon in these peculiar objects is still unclear, but confirmation of high detection rates in NLSy1 indicates that this question requires more in-depth studies.
To consolidate our overall results, we also compared the above rates with those obtained from the 70-month (Baumgartner et al. 2013) and 9-month (Tueller et al. 2008) Swift/BAT samples. These two samples were selected to be almost comparable in size with the INTEGRAL total and complete sub-samples.
The 70-month BAT survey provides the list of all objects detected by the instrument during the first 6.8 years of the Swift mission and covers 90% of the sky at a sensitivity level of 1.3 × 10⁻¹¹ ergs s−1 cm−2 in the 14–195 keV band. The sample contains a large fraction of unclassified sources that may turn out to be AGN after proper follow-up work; thus our search for maser detection provides only an indication of the level of maser occurrence in this large BAT sample. To search for water maser emission in this set of hard X-ray selected AGN, we were helped by three high-school students during a stage performed at OAS/INAF in Bologna in 2016. As for the INTEGRAL sample, we searched the available archives, such as the MCP and the literature, for reports of water maser observations and detections for all 822 AGN reported in the BAT survey. Altogether, we found that only 285 objects of this sample (only 35%) have been observed at 22 GHz and 36 objects have been detected. The detection fraction is therefore about 13 ± 2%, which perfectly agrees with our INTEGRAL results. Most of the detections overlap the INTEGRAL detections; the additional sources are NGC 235A, UGC 3157, VII Zw 073, NGC 3393, CGCG 164-019, MKN 78, UGC 5101, and M 82 considering that IGR J16385-2057 and NGC 6926 were only detected by INTEGRAL. We note that in the case of M 82, the emission above 10 keV is dominated by a few ultra-luminous X-ray sources (ULXs) with a minor contribution from lower luminosity X-ray binaries (Vulic et al. 2018) and can therefore not be attributed to AGN activity.
The Swift/BAT 9-month catalogue contains only 154 sources (all of which are identified and optically classified as AGN) and covers 74% of the sky (only the sky above ±15 degrees in latitude was considered to avoid contamination by galactic objects) at a flux threshold of 5 × 10⁻¹¹ ergs s−1 cm−2 in the 14–195 keV band. In this catalogue, 114 objects have been observed at 22 GHz and 17 are detected (listed in Table A.2). Only 40 AGN have no observational coverage at the waveband of interest here. The detection rate is 15 ± 4%. Applying the same exercise as for the INTEGRAL samples (i.e. assuming all unobserved sources to be either detected or undetected at 22 GHz), we estimate a possible range of values between 11 and 37%. When we restrict this to type 2 AGN alone, 51 of 65 objects in this sample have been observed, and 13 objects display maser emission. This provides a detection rate close to 26 ± 7%. In this case, the possible range of values is estimated to vary from 20 to 41%, which again fully agrees with the estimates obtained from the INTEGRAL samples.
Finally, we compared our results, in particular, those obtained for type 2 Seyferts, with the optical data set of AGN discussed by Diamond-Stanic et al. (2009). These authors have compiled a complete sample of 89 Seyfert galaxies, made of 18 type 1 (1–1.5) and 71 type 2 (1.8–2) AGN, all within a distance of 200 Mpc. The entire sample has been covered by water maser observations and is therefore a reference catalogue for this type of studies. There are 21 masers (listed in Table A.3) and 68 non-maser sources in this sample, providing a detection rate of 24 ± 5%. When we restrict the estimate to Seyfert 2 galaxies alone, the detection rate increases only slightly to 27%, again in full agreement with the estimate provided in this work. The highest detection rate found in this sample appears to contrast with estimates obtained using other optically selected samples of AGN (e.g. Zhu et al. 2011 quote a detection rate of almost 8% for Seyfert 2 galaxies), but this may be due to the fact that the Diamond-Stanic et al. (2009) sample is biased in favour of close-by AGN, mostly of type 2, similarly to the sample that was investigated in Panessa & Giroletti (2013).
The detection fractions for all samples considered in this work are summarised in Table 1, which clearly shows that hard X-ray catalogues provide a significant boost of the maser detection fraction with respect to large optical surveys (e.g. Zhu et al. 2011; Braatz et al. 2018): they reach values of at least 15–25%. These values are also higher than those obtained by specifically tuning the AGN selection in the IR band using different criteria and combining them, as recently proposed by Kuo et al. (2018). Furthermore, the hard X-ray selection, in addition to providing a catalogue of galaxies with a high probability of maser detection, also provides a set of sources with clear evidence of AGN activity and therefore negligible or null contamination from star-forming objects.
Summary of the detection fractions for different samples and sub-samples.
5. Improving the detection probability
In Fig. 2 we plot the water maser detection rate in our total sample and in the complete sub-sample as a function of redshift (left panel), X-ray nuclear absorption (middle panel), and 20–100 keV hard X-ray luminosity (right panel). For the distribution of the water maser fraction as a function of redshift and column density, objects were grouped so that about the same number of observed sources is shown in each bin. For the distribution in luminosity, this was more difficult to achieve while still maintaining a reasonable number of bins, but the uncertainty related to this choice is reflected in the error associated with each bin.
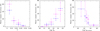 |
Fig. 2. Fraction of detected water maser emission vs. redshift limited to z < 0.04, X-ray column density in cm−2 (central panel), and 20–100 keV luminosity in ergs s−1 cm−2 (right panel). Blue starred points represent the total sample, and magenta polygons show the complete sub-sample. |
It is evident that water maser detection decreases as a function of redshift from about 40–60% at low redshifts to a few percent at higher distances (above z = 0.015), in agreement with the distance bias discussed in Sects. 2 and 3. In contrast, the detection fraction increases for higher X-ray column densities from a few percent to 25–40% at a threshold of 1023 cm−2 and reaches 56 ± 18% above the Compton-thick regime in the case of the total sample (50 ± 35 for the complete sample). This again confirms that the water maser detection is favoured among heavily absorbed AGN. The hard X-ray luminosity also appears to play a role, although in these cases, the error bars are larger and the scarce observations of highly luminous sources may affect this result: a decline in detection fraction is seen from low to high luminosities, which may be an indication that an extremely luminous nuclear environment does not favour maser emission. As discussed in Castangia et al. (2013 and references therein), for high nuclear bolometric luminosities or environments that are particularly heavily exposed to strong X-ray radiation, H2O maser emission at sub-parsec distances from the nucleus of the galaxy may be hampered because the ISM is mostly atomic and/or the dust grains (where water is thought to be often formed) are destroyed. While maser emission can still be produced at larger distances, the innermost (hundredths of parsecs) masing action would be prevented if this scenario is correct. In addition, an increased bolometric luminosity might decrease the maser emissivity by reducing the difference between gas and dust temperatures (Kuo et al. 2018), on which the volume rate of maser photon production significantly depends (Gray et al. 2016).
The fractions for the total and the complete sub-samples are consistent within the errors and the trends are confirmed for the two samples. However, the statistics is limited by the small number of data sets, especially for the complete sub-sample.
6. Maser type of INTEGRAL AGN
Most maser detections reported in this work have been discussed in the literature and their maser type has been analysed in previous works (see type and relative references in the notes of Table A.1). In the following and in Table A.1, we considered as disc, outflow, or jet maser sources for which the maser class is either fully assessed or just suggested on the basis of observational results; for these last objects, only follow-up, mainly interferometric VLBI, continuum, and spectral line studies can confirm a water maser association with AGN activity and maser type.
Only 6 sources in the sample of 29 maser detections (IGR J05081+1722, NGC 3081, NGC 3783, NGC 5643, NGC 6300, and ESO 103-G35) have no associated maser classification; in Appendix B we attempt to provide some indication of the possible nature of these sources and implicitly discuss their most likely maser type. Table A.1 shows that the water maser classification generally refers to one, or in some cases, two components, such as a disc plus outflow or jet.
When we exclude these 6 sources from our sample of AGN with 22 GHz detection, we note that similar numbers (12–12) of objects have a disc (or evidence of disc) and a jet (or evidence of jet) water emission; outflow or evidence of outflow emission is present in 7 sources. Despite the uncertainties involved in water maser classification, it is evident from the present sample that all types of masers are likely associated with INTEGRAL AGN and that discs masers are not necessarily the dominant type. Thus hard X-ray surveys also offer the opportunity of probing masers of different types.
Finally, we note that the maser type of all optical narrow-line AGN (including type 1 and NLSy1) is likely related to jet and/or outflow emission, and none is apparently associated with accretion discs. Type 2 AGN instead seem to display all types of water masers: out of 24 Seyfert 2 that are detected, the emission in 12 is partly or entirely associated with a disc, in 8 with a jet, and only in 3 with outflow. Maser sources associated with edge-on (i = 90 ± 10 degrees, see Sect. 8) discs are most likely, and not surprisingly according to the unified model, found in type 2 AGN.
7. Maser versus non-maser INTEGRAL AGN
One main question that is still unanswered in extragalactic maser astrophysics is related to the conditions that lead to maser emission in only a fraction of AGN. It is therefore reasonable to ask whether water maser galaxies have special intrinsic properties in terms of X/hard X-ray luminosities and absorption compared to apparently similar galaxies without detected maser emission.
According to theory, high-energy radiation from the central part of an AGN could heat the circumnuclear gas temperature to values suitable for maser emission (Neufeld et al. 1994); in this case, we expect a relationship between the maser luminosity and the X-ray/hard X-ray luminosities. Kondratko et al. (2006a) studied a sample of 30 water maser AGN and indeed found such a relation ( ), where LX is the unabsorbed X-ray luminosity in the 2–10 keV band; the significance of this correlation improved when the sample was limited to disc masers. However, the relation still presented a large scatter, likely due to a dependence on different parameters, such as the mass accretion rate, the ratio of X-ray to bolometric luminosity, and the well-known X-ray and maser variability (in the latter, this typically is about some dozen percent, e.g. Maloney 2002 and references therein). This relation seems to be weak or absent in more recent studies even when only disc maser sources were considered, which are the sources in which the correlation is expected to be stronger (Castangia et al. 2013).
A more direct estimate of the AGN radiation field is provided by the hard X-ray luminosity, which is the least affected in terms of nuclear absorption; this information is available for all our objects and has never been employed before in a correlation with the maser luminosity. In Fig. 3 (left and middle panels) we therefore plot the isotropic water maser luminosity as a function of the 20–100 keV and 2–10 keV observed luminosities. When the regression analysis is only applied to the detected sources, the Spearman Rho correlation coefficients are 0.16 and 0.10, providing a two-tailed probability of 0.42 and 0.59, respectively. Therefore the association between the two variables should not be considered statistically significant. The sources of scatter as discussed in Kondratko et al. (2006a) analogously apply to our relations.
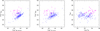 |
Fig. 3. Logarithmic water maser luminosity vs. 20–100 keV (left panel) and 2–10 keV logarithmic luminosities (central panel), expressed in ergs s−1 cm−2. Water maser luminosity vs. the logarithmic X-ray column density in cm−2 (right panel). Empty magenta polygons are water maser detected sources, and blue arrows represent the upper limits to the water maser luminosity. |
Finally, we note here also that the range of hard X-ray and X-ray luminosities of detected masers cover a similar interval as non maser AGN, therefore no evident luminosity threshold could be identified as maser activator above L2 − 10 keV ∼ 1040 ergs s−1. In addition, the sensitivity of 22 GHz surveys is no limit for maser detection because luminosity upper limits are also found at a factor of about 10 to 100 below detections.
As discussed by Zhang et al. (2006), a correlation between water maser luminosity and X-ray absorption (approximately  ) is also expected for idealised saturated maser emission (assuming no velocity gradients in the maser region). In this case, the value of the exponent is determined by the luminosity that linearly increases with the column density and the surface of the masing cone, which grows with the square of its lengths (e.g. Kylafis & Norman 1991). In Fig. 3 (right panel), we display the isotropic water maser luminosity as a function of the X-ray absorption for maser and non-maser sources. When we again consider only detected sources, the resulting Spearman Rho correlation coefficient is 0.37 with a derived two-tailed probability of 0.05, suggesting that the association between the two variables might only be marginally considered statistically significant. This again confirms that the X-ray obscuring medium is associated with the masing material.
While an interpretation based on the different maser types would be interesting, it would reduce the number of sources that are tested because variety of maser types in our sources is great. This would weaken the significance of these relations. In addition, the high complexity of the different maser components complicates the interpretation of these correlations.
8. Water masers in Compton-thick AGN
Of the 21 objects of the total sample in the CT regime, 8 have no maser detection, 10 have a maser detection, and 3 have not yet been observed. Therefore the probability is about 56 ± 18% to detect maser emission in the Compton-thick AGN set selected in the hard X-ray band (see also Sect. 5). This is in line with the noticeably large fraction of water masers (50%) found by Castangia et al. (2019), who studied a sample of heavily absorbed AGN, including CT sources, that were selected through a combination of mid-IR and X-ray data. We note that all CT AGN in the INTEGRAL sample show evidence of an association with discs (sometimes accompanied by jet and outflow components), except for Mkn 3, which is tentatively associated with a jet origin only (a core plus jet component is seen in the radio continuum maps of this source, Chiaraluce et al. 2020). When we exclude Mkn 3, the fraction of disc masers in CT is 50 ± 17%. The interesting question here is why some sources are able to develop strong maser emission while others are not. In other words, if all Compton-thick AGN are potentially water maser emitters, why are only half of them able to reach luminosities high enough (above 1033 erg cm−2 s−1, see Fig. 1) for the current generation of radio receivers?
Masini & Comastri (2018) have estimated that the expected disc water maser detection fraction among type 2 Seyferts in a volume-limited survey is about 10% to 20%. This value has been obtained by comparing the torus and maser disc covering factors (see their Eq. (2.1)) and assuming that a maser disc is detected when the line of sight angle ranges between 90 ± 10° with respect to the polar axis and defining the probability of detecting a maser disc in a type 2 AGN as the ratio of the maser disc covering factor with respect to the torus one. This assumption might be inverted considering a covering factor for the CT part of the torus as derived from X-ray arguments (Ricci et al. 2017) to be ∼23% (which also agrees with IR arguments, e.g. Hönig et al. 2018) and using the information on the ratio between the water maser and CT covering factors to be 50%, to finally derive the expected maser disc inclination angle to range between 82 and 87°. These values agree with the observed disc angles in well-known disc masers (Kuo et al. 2011; König et al. 2012), which confirms the idea that the masing disc is only a portion of the total CT medium (for a sketch of the possible geometry discussed here, see Fig. 2 in Masini et al. 2016). The maser covering factor could be considered as a lower limit when we assume the presence of warped discs, which is expected to increase the probability of intercepting maser emission (Darling 2017). Similarly, the known water maser variability might contribute to a possible non-detection if the masers flux decreases below the instrument sensitivity and therefore to an underestimate of the covering factor. Other effects contribute to our uncertainties in these estimates, for instance, X-ray scattering in clumpy media might dilute the true line-of-sight column density and thus prevent us from deriving unbiased orientation information (Ramolla et al. 2011). Despite the uncertainties involved, it is important to stress that the 50% detection fraction in Compton-thick AGN can in principle be explained in terms of a geometrical effect (i.e. proper opening angles of torus and maser disc and their relative alignment) and may not be due to peculiarities of individual objects.
9. Conclusions
Notwithstanding the valuable science that can be derived for AGN and cosmological studies, water megamasers are rarely found in galaxy surveys (e.g. Braatz et al. 2018). We here selected a sample of hard X–ray AGN detected above 20 keV by INTEGRAL/IBIS and searched for water megamaser emission among them in the literature and through our new dedicated observations (where one new maser detection was obtained). Of the 380 sources of the sample, only 51% have been observed at 22 GHz. In 15 ± 3% of them, a detection was made. We also considered a sub-sample of 87 sources, limited in volume and statistically complete, and found that the detection fraction increases to 19 ± 5%. Most observed sources are at low redshift, and this is reflected by the observed detection fraction, which decreases with increasing redshift. This likely introduces a bias in our sample.
So far, the detection rates observed in large surveys of optically selected galaxies were about a few percent, which could only be improved by carefully selecting smaller samples on the basis of IR (8–22%; Hagiwara et al. 2002, 2003; Henkel et al. 2005) or a combination of mid-IR and X-ray data (50%; Castangia et al. 2019). Therefore, the hard X–ray selection provides one of the highest rates ever observed so far.
These fractions increase in type 2 Seyfert galaxies (22 ± 5%), in particular in CT AGN, about 50% of which host water maser discs. This clearly indicates that the X-ray obscuring gas is related to the maser dusty medium. A comparison between the covering factor of the CT obscuring medium and the fraction of water masers in CT sources confirms the idea that the masing disc might only be a portion of the CT obscuring medium and that an edge-on line of sight (i > 82 degrees) is required for the water maser emission to be detected.
A possible decrease in detection fraction is observed as the hard X-ray luminosity increases, suggesting that a highly luminous nuclear environment might not favour maser emission. However, this result can be confirmed by completing the sample observations at higher luminosity. On the other hand, no significant correlation between the water maser and X-ray and hard X-ray luminosities has been found, while the marginally significant correlation between the water maser luminosity and the X-ray column density simply reflects the connection between the X-ray obscuring and the masing media.
All types of water masers are found by the soft gamma-ray selection of sources. Interestingly, all of the few water masers detected in type 1 AGN are jet or outflow candidates, while in type 2 AGN all types of masers are detected. This suggests that the dusty water maser medium is not solely associated with a classical obscuring torus, but might also reside in polar outflows or jets. This implies a more complex geometry, as envisaged by recent IR interferometric studies (see Hönig et al. 2018).
Overall, we conclude that hard X-ray samples of AGN provide the opportunity of significantly increasing the maser detection efficiency compared to previous surveys. Extremely high detection fractions (up to 50%) can be reached by targeting type 2 or heavily absorbed AGN that are nearby and in an optimised luminosity range. The discovery of new heavily absorbed sources with the increased sensitivity of the ongoing INTEGRAL/IBIS and Swift/BAT surveys together with the wealth of new sources that the eROSITA survey (Merloni 2018) will discover below 10 keV will offer the possibility to largely increase the samples for future water maser searches, and hopefully, detections.
Calibration information for the 1.3 cm PFK receiver is reported in the Effelsberg Wiki page https://eff100mwiki.mpifr-bonn.mpg.de/doku.php
As shown on the MCP webpage
As shown on the MCP webpage.
Shown on the MCP webpage.
Acknowledgments
The authors wish to thank the referee for her/his valuable comments that considerably improved our manuscript. AT and PC would like to thank Jim Braatz for providing information on some of the maser sources, prior to publication. FP, AM, LB, AB and PU acknowledge financial support from ASI under contract INTEGRAL ASI/INAF n.2019-35-HH. We acknowledge the help of 3 high school students (Alice Bizzarri, Andrea Cocozza and Fulvio Talarico) in the analysis of the BAT 70 m sample; they all participated in a summer stage at OAS/INAF Bologna during 2016. This project, being partly conducted by amateur astronomers under the supervision of professional scientists, represents a nice example on how citizen science work can help in dealing with a large data set.
References
- Alonso-Herrero, A., Pereira-Santaella, M., García-Burillo, S., et al. 2018, ApJ, 859, 144 [Google Scholar]
- Antonucci, R. R. J., & Miller, J. S. 1985, ApJ, 297, 621 [NASA ADS] [CrossRef] [Google Scholar]
- Ballo, L., Severgnini, P., Braito, V., et al. 2015, A&A, 581, A87 [NASA ADS] [CrossRef] [EDP Sciences] [Google Scholar]
- Baumgartner, W. H., Tueller, J., Markwardt, C. B., et al. 2013, ApJS, 207, 19 [NASA ADS] [CrossRef] [EDP Sciences] [Google Scholar]
- Bennert, N., Schulz, H., & Henkel, C. 2004, A&A, 419, 127 [NASA ADS] [CrossRef] [EDP Sciences] [Google Scholar]
- Bennert, N., Barvainis, R., Henkel, C., et al. 2009, ApJ, 695, 276 [NASA ADS] [CrossRef] [Google Scholar]
- Bird, A. J., Malizia, A., Bazzano, A., et al. 2007, ApJS, 170, 175 [NASA ADS] [CrossRef] [Google Scholar]
- Bird, A. J., Bazzano, A., Malizia, A., et al. 2016, ApJS, 223, 15 [NASA ADS] [CrossRef] [Google Scholar]
- Braatz, J. 2008, A Decade of Dark Energy, 5 [Google Scholar]
- Braatz, J. A., & Gugliucci, N. E. 2008, ApJ, 678, 96 [NASA ADS] [CrossRef] [Google Scholar]
- Braatz, J. A., Wilson, A. S., & Henkel, C. 1996, ApJS, 106, 51 [NASA ADS] [CrossRef] [Google Scholar]
- Braatz, J. A., Wilson, A. S., & Henkel, C. 1997, ApJS, 110, 321 [NASA ADS] [CrossRef] [Google Scholar]
- Braatz, J. A., Reid, M. J., Greenhill, L. J., et al. 2008, Frontiers of Astrophysics:A Celebration of Nrao’s 50th Anniversary, 103 [Google Scholar]
- Braatz, J. A., Reid, M. J., Humphreys, E. M. L., et al. 2010, ApJ, 718, 657 [NASA ADS] [CrossRef] [Google Scholar]
- Braatz, J., Condon, J., Constantin, A., et al. 2015, IAU Gen. Assembly, 29, 2255730 [Google Scholar]
- Braatz, J., Pesce, D., Condon, J., et al. 2018, Science with a Next Generation Very Large Array, 821 [Google Scholar]
- Castangia, P., Panessa, F., Henkel, C., et al. 2013, MNRAS, 436, 3388 [NASA ADS] [CrossRef] [Google Scholar]
- Castangia, P., Surcis, G., Tarchi, A., et al. 2019, A&A, 629, A25 [NASA ADS] [CrossRef] [EDP Sciences] [Google Scholar]
- Chiaraluce, E., Panessa, F., Bruni, G., et al. 2020, MNRAS, 495, 3943 [CrossRef] [Google Scholar]
- Darling, J. 2017, ApJ, 837, 100 [NASA ADS] [CrossRef] [Google Scholar]
- Davies, R. I., Maciejewski, W., Hicks, E. K. S., et al. 2014, ApJ, 792, 101 [NASA ADS] [CrossRef] [Google Scholar]
- Decarli, R., Dotti, M., Fontana, M., et al. 2008, MNRAS, 386, L15 [CrossRef] [Google Scholar]
- Diamond-Stanic, A. M., Rieke, G. H., & Rigby, J. R. 2009, ApJ, 698, 623 [Google Scholar]
- Elitzur, M. 1992, Astrophys. Space Sci. Lib., 170 [CrossRef] [Google Scholar]
- Elitzur, M., & Shlosman, I. 2006, ApJ, 648, L101 [NASA ADS] [CrossRef] [Google Scholar]
- Fukumura, K., Kazanas, D., Shrader, C., et al. 2018, ApJ, 853, 40 [NASA ADS] [CrossRef] [Google Scholar]
- Gallimore, J. F., Baum, S. A., O’Dea, C. P., et al. 1996, ApJ, 458, 136 [NASA ADS] [CrossRef] [Google Scholar]
- Gallimore, J. F., Henkel, C., Baum, S. A., et al. 2001, ApJ, 556, 694 [NASA ADS] [CrossRef] [Google Scholar]
- Gear, W. K., Stevens, J. A., Hughes, D. H., et al. 1994, MNRAS, 267, 167 [NASA ADS] [CrossRef] [Google Scholar]
- Gehrels, N., Chincarini, G., Giommi, P., et al. 2004, ApJ, 611, 1005 [NASA ADS] [CrossRef] [Google Scholar]
- Gofford, J., Reeves, J. N., McLaughlin, D. E., et al. 2015, MNRAS, 451, 4169 [Google Scholar]
- Gray, M. D., Baudry, A., Richards, A. M. S., et al. 2016, MNRAS, 456, 374 [NASA ADS] [CrossRef] [Google Scholar]
- Greenhill, L. J., Ellingsen, S. P., Norris, R. P., et al. 2002, ApJ, 565, 836 [NASA ADS] [CrossRef] [Google Scholar]
- Greenhill, L. J., Kondratko, P. T., Lovell, J. E. J., et al. 2003a, ApJ, 582, L11 [NASA ADS] [CrossRef] [Google Scholar]
- Greenhill, L. J., Booth, R. S., Ellingsen, S. P., et al. 2003b, ApJ, 590, 162 [NASA ADS] [CrossRef] [Google Scholar]
- Greenhill, L. J., Tilak, A., & Madejski, G. 2008, ApJ, 686, L13 [NASA ADS] [CrossRef] [Google Scholar]
- Greenhill, L. J., Kondratko, P. T., Moran, J. M., et al. 2009, ApJ, 707, 787 [NASA ADS] [CrossRef] [Google Scholar]
- Guilloteau, S., & Lucas, R. 2000, Imaging at Radio Through Submillimeter Wavelengths, 299 [Google Scholar]
- Hagiwara, Y., & Edwards, P. G. 2015, ApJ, 815, 124 [NASA ADS] [CrossRef] [Google Scholar]
- Hagiwara, Y., Diamond, P. J., & Miyoshi, M. 2002, A&A, 383, 65 [NASA ADS] [CrossRef] [EDP Sciences] [Google Scholar]
- Hagiwara, Y., Diamond, P. J., Miyoshi, M., et al. 2003, MNRAS, 344, L53 [NASA ADS] [CrossRef] [Google Scholar]
- Henkel, C., Guesten, R., Downes, D., et al. 1984, A&A, 141, L1 [Google Scholar]
- Henkel, C., Peck, A. B., Tarchi, A., et al. 2005, A&A, 436, 75 [NASA ADS] [CrossRef] [EDP Sciences] [Google Scholar]
- Herrnstein, J. R., Moran, J. M., Greenhill, L. J., et al. 1997, ApJ, 475, L17 [NASA ADS] [CrossRef] [Google Scholar]
- Humphreys, E. M. L., Vlemmings, W. H. T., Impellizzeri, C. M. V., et al. 2016, A&A, 592, L13 [NASA ADS] [CrossRef] [EDP Sciences] [Google Scholar]
- Hönig, S. F., Alonso Herrero, A., Gandhi, P., et al. 2018, Exp. Astron., 46, 413 [CrossRef] [Google Scholar]
- Jarosik, N., Bennett, C. L., Dunkley, J., et al. 2011, ApJS, 192, 14 [NASA ADS] [CrossRef] [Google Scholar]
- Kamali, F., Henkel, C., Brunthaler, A., et al. 2017, A&A, 605, A84 [NASA ADS] [CrossRef] [EDP Sciences] [Google Scholar]
- Kameno, S., Nakai, N., Sawada-Satoh, S., et al. 2005, ApJ, 620, 145 [NASA ADS] [CrossRef] [Google Scholar]
- Kondratko, P. T., Greenhill, L. J., & Moran, J. M. 2005, ApJ, 618, 618 [NASA ADS] [CrossRef] [Google Scholar]
- Kondratko, P. T., Greenhill, L. J., & Moran, J. M. 2006a, ApJ, 652, 136 [NASA ADS] [CrossRef] [Google Scholar]
- Kondratko, P. T., Greenhill, L. J., Moran, J. M., et al. 2006b, ApJ, 638, 100 [NASA ADS] [CrossRef] [Google Scholar]
- König, S., Eckart, A., Henkel, C., et al. 2012, MNRAS, 420, 2263 [NASA ADS] [CrossRef] [Google Scholar]
- Kuo, C. Y., Braatz, J. A., Condon, J. J., et al. 2011, ApJ, 727, 20 [NASA ADS] [CrossRef] [Google Scholar]
- Kuo, C. Y., Constantin, A., Braatz, J. A., et al. 2018, ApJ, 860, 169 [NASA ADS] [CrossRef] [Google Scholar]
- Kylafis, N. D., & Norman, C. A. 1991, ApJ, 373, 525 [NASA ADS] [CrossRef] [Google Scholar]
- Leipski, C., Falcke, H., Bennert, N., et al. 2006, A&A, 455, 161 [NASA ADS] [CrossRef] [EDP Sciences] [Google Scholar]
- Liu, Z. W., Zhang, J. S., Henkel, C., et al. 2017, MNRAS, 466, 1608 [NASA ADS] [CrossRef] [Google Scholar]
- Lo, K. Y. 2005, ARA&A, 43, 625 [NASA ADS] [CrossRef] [Google Scholar]
- Malizia, A., Stephen, J. B., Bassani, L., et al. 2009, MNRAS, 399, 944 [NASA ADS] [CrossRef] [Google Scholar]
- Malizia, A., Bassani, L., Bazzano, A., et al. 2012, MNRAS, 426, 1750 [NASA ADS] [CrossRef] [Google Scholar]
- Malizia, A., Landi, R., Molina, M., et al. 2016, MNRAS, 460, 19 [CrossRef] [Google Scholar]
- Maloney, P. R. 2002, PASA, 19, 401 [NASA ADS] [CrossRef] [Google Scholar]
- Masini, A., & Comastri, A. 2018, Astrophysical Masers Unlocking the Mysteries of the Universe, 133 [Google Scholar]
- Masini, A., Comastri, A., Baloković, M., et al. 2016, A&A, 589, A59 [NASA ADS] [CrossRef] [EDP Sciences] [Google Scholar]
- Mathur, S. 2000, MNRAS, 314, L17 [NASA ADS] [CrossRef] [Google Scholar]
- Mehdipour, M., Kaastra, J. S., Kriss, G. A., et al. 2017, A&A, 607, A28 [NASA ADS] [CrossRef] [EDP Sciences] [Google Scholar]
- Merloni, A. 2018, AGN13: Beauty and the Beast, 71 [Google Scholar]
- Miyoshi, M., Moran, J., Herrnstein, J., et al. 1995, Nature, 373, 127 [NASA ADS] [CrossRef] [Google Scholar]
- Morganti, R., Tsvetanov, Z. I., Gallimore, J., et al. 1999, A&AS, 137, 457 [NASA ADS] [CrossRef] [EDP Sciences] [Google Scholar]
- Neufeld, D. A., Maloney, P. R., & Conger, S. 1994, ApJ, 436, L127 [NASA ADS] [CrossRef] [Google Scholar]
- Oh, K., Koss, M., Markwardt, C. B., et al. 2018, ApJS, 235, 4 [NASA ADS] [CrossRef] [Google Scholar]
- Orienti, M., & Prieto, M. A. 2010, MNRAS, 401, 2599 [NASA ADS] [CrossRef] [Google Scholar]
- Ott, J., Meier, D. S., McCoy, M., et al. 2013, ApJ, 771, L41 [CrossRef] [Google Scholar]
- Padovani, P., Alexander, D. M., Assef, R. J., et al. 2017, A&A Rev., 25, 2 [NASA ADS] [CrossRef] [Google Scholar]
- Panessa, F., & Giroletti, M. 2013, MNRAS, 432, 1138 [NASA ADS] [CrossRef] [Google Scholar]
- Panessa, F., de Rosa, A., Bassani, L., et al. 2011, MNRAS, 417, 2426 [NASA ADS] [CrossRef] [Google Scholar]
- Peck, A. B., Henkel, C., Ulvestad, J. S., et al. 2003, ApJ, 590, 149 [NASA ADS] [CrossRef] [Google Scholar]
- Pesce, D. W., Braatz, J. A., Condon, J. J., et al. 2015, ApJ, 810, 65 [NASA ADS] [CrossRef] [Google Scholar]
- Ramolla, M., Haas, M., Bennert, V. N., et al. 2011, A&A, 530, A147 [NASA ADS] [CrossRef] [EDP Sciences] [Google Scholar]
- Reid, M. J., Braatz, J. A., Condon, J. J., et al. 2009, ApJ, 695, 287 [NASA ADS] [CrossRef] [Google Scholar]
- Ricci, C., Trakhtenbrot, B., Koss, M. J., et al. 2017, Nature, 549, 488 [NASA ADS] [CrossRef] [Google Scholar]
- Sato, N., Yamauchi, A., Ishihara, Y., et al. 2005, PASJ, 57, 587 [NASA ADS] [Google Scholar]
- Schnorr-Müller, A., Storchi-Bergmann, T., Robinson, A., et al. 2016, MNRAS, 457, 972 [NASA ADS] [CrossRef] [Google Scholar]
- Tarchi, A. 2012, Cosmic Masers - from OH to H0, 323 [Google Scholar]
- Tarchi, A., Henkel, C., Chiaberge, M., et al. 2003, A&A, 407, L33 [NASA ADS] [CrossRef] [EDP Sciences] [Google Scholar]
- Tarchi, A., Castangia, P., Henkel, C., et al. 2011a, A&A, 525, A91 [NASA ADS] [CrossRef] [EDP Sciences] [Google Scholar]
- Tarchi, A., Castangia, P., Columbano, A., et al. 2011b, A&A, 532, A125 [NASA ADS] [CrossRef] [EDP Sciences] [Google Scholar]
- Tilak, A., Greenhill, L. J., Done, C., et al. 2008, ApJ, 678, 701 [NASA ADS] [CrossRef] [Google Scholar]
- Tueller, J., Mushotzky, R. F., Barthelmy, S., et al. 2008, ApJ, 681, 113 [NASA ADS] [CrossRef] [Google Scholar]
- Ubertini, P., Lebrun, F., Di Cocco, G., et al. 2003, A&A, 411, L131 [NASA ADS] [CrossRef] [EDP Sciences] [Google Scholar]
- van den Bosch, R. C. E., Greene, J. E., Braatz, J. A., et al. 2016, ApJ, 819, 11 [CrossRef] [Google Scholar]
- Vulic, N., Hornschemeier, A. E., Wik, D. R., et al. 2018, ApJ, 864, 150 [CrossRef] [Google Scholar]
- Wang, J., Zhang, J.-S., & Fan, J.-H. 2010, Res. Astron. Astrophys., 10, 915 [CrossRef] [Google Scholar]
- Yamashita, T., Komugi, S., Matsuhara, H., et al. 2017, ApJ, 844, 96 [NASA ADS] [CrossRef] [Google Scholar]
- Zhang, J. S., Henkel, C., Kadler, M., et al. 2006, A&A, 450, 933 [NASA ADS] [CrossRef] [EDP Sciences] [Google Scholar]
- Zhang, J. S., Henkel, C., Guo, Q., et al. 2012, A&A, 538, A152 [NASA ADS] [CrossRef] [EDP Sciences] [Google Scholar]
- Zhang, J. S., Liu, Z. W., Henkel, C., et al. 2017, ApJ, 836, L20 [CrossRef] [Google Scholar]
- Zhu, G., Zaw, I., Blanton, M. R., et al. 2011, ApJ, 742, 73 [NASA ADS] [CrossRef] [Google Scholar]
Appendix A: Tables with the total sample and detection fractions in the Swift/BAT and Diamond-Stanic samples
Table A.1 lists all 380 INTEGRAL/IBIS AGN with their optical coordinates, redshift, class, hard X-ray (20–100 keV) flux, X-ray (2–10 keV) flux, X-ray column density, a note to indicate whether the source was observed at 22 GHz, which maser type was detected, and respective references. Finally, for sources for which maser emission was detected, we also list the reported water maser isotropic luminosity and the reference to the maser data; for objects observed at 22 GHz but without a detected maser, we report the 1σ rms and an upper limit to the maser luminosity. Objects belonging to the complete sample are highlighted in boldface in Table A.1 for clarity.
In Table A.2 we report the 17 detected sources from the Swift/BAT 9 catalogue with their names, optical classification as type 1 or 2 AGN, and coordinates. Analogously, in Table A.3, the 21 AGN detected at 22 GHz from the Diamond-Stanic et al. (2009) sample are reported.
AGN in the BAT 9-month survey sample with water maser detections.
Maser galaxies in the Diamond-Stanic et al. (2009) sample.
Appendix B: Maser types
Of the INTEGRAL AGN with maser detection, only six sources (IGR J05081+1722, NGC 3081, NGC 3783, NGC 5643, NGC 6300, and ESO 103-G35) so far have no associated maser type. Here we discuss each source individually and provide some clues on their most likely maser type.
IGR J05081+1722 is interesting from many points of view. It belongs to an IR-luminous interacting pair of galaxies that is characterised by a luminosity for the whole system (made of a combination of star formation and accretion) of log(LIR/L⊙) = 11.2. The system is at an early stage of merger (11.3 kpc distance) and is known to host an AGN that has optically been classified as Seyfert 2 plus a normal galaxy. The AGN, which is also the component in the system that displays water maser emission, hosts a molecular outflow and probably also a disc wind (Yamashita et al. 2017; Ballo et al. 2015). NGC 3783 is one of the most intensively monitored Seyfert galaxy at high energies. It is known to exhibit UV absorbers plus a series of ionised X-ray absorbers that are variable in time (Fukumura et al. 2018; Mehdipour et al. 2017). These have generally been interpreted as associated with a strong obscuring outflow in the nuclear region. In contrast to other sources in our sample, neither IGR J05081+1722 nor NGC 3783 display strong X-ray absorption (their column densities are about 1022 at cm−2), suggesting that their water maser emission might indeed be associated with a jet or outflow. Because no clear jet emission appears to be present in NGC 3783, but only a diffuse radio emission on tens of pc–scales (Orienti & Prieto 2010), the outflow remains the only option; the situation is less clear in IGR J05081+1722, but the outflow is a viable possibility to explain water maser emission in this source as well. Single-dish maser spectra for these sources5 are consistent with an outflow origin. In particular, the maser emission in IGR J05081+1722 is blueshifted with respect to the systemic velocity (by about 100 km s−1) and appears to consist of a handful of narrow components that are attached to a broader feature. The maser spectrum in NGC 3783 is instead characterised by a group of narrow features that are close to the systemic velocity of the galaxy. Clearly, the nature of the maser cannot be uniquely assessed without high-resolution follow-up studies.
NGC 6300 and ESO 103-G35 are type 2 mildly absorbed AGN with column densities of about 1023 at cm−2. NGC 6300 features a slightly resolved radio core at arcsecond resolution with an extension in the southern direction (Morganti et al. 1999), and there is also evidence for a complex molecular hydrogen structure made of an edge-on outflow superimposed on a rotating disc (Davies et al. 2014). ESO 103-G35 does not show evidence for a radio jet; furthermore, an in-depth analysis of the galaxy optical properties brought no clues on the origin of water maser emission, including no evidence for outflows (Bennert et al. 2004). Despite this, the source has been reported in X-rays as the site of a highly ionized outflow (Gofford et al. 2015). As in the two previous cases, the interpretation (among others) of an outflow origin of the water maser emission does not contradict the shape of the maser spectra6 for NGC 6300 (Greenhill et al. 2003b) and ESO 103-G35. In both cases, emission is detected close to (or slightly redshifted with respect to) the systemic velocity of the target, and it is comprised of a very small number of narrow features (one in the case of ESO 103-G35) that are placed above a broader component. A somewhat different spectrum of ESO 103-G35 is shown in the detection paper (Braatz et al. 1996), however, where emission from a single 20 km s−1 wide line is shown that is clearly redshifted by ∼100 km s−1 with respect to the systemic velocity.
Finally, NGC 5643 and NGC 3081 are heavily absorbed objects (NGC 3081 is also Compton thick). In these objects, nuclear discs are likely to be the site where maser emission develops. Recent observations with ALMA of NGC 5643 (Alonso-Herrero et al. 2018) have at the parsec scale resolved a massive rotating disc or torus of molecular gas with strong non-nuclear motion features associated with radial outflow in the disc. Interestingly, the maser emission appears to be centrally located with respect to the inner (nuclear) part of this structure, which is also tilted with respect to the larger scale disc. The inner structure of NGC 3081 has instead been mapped with the Gemini Multi Object Spectrograph (GMOS-IFU; Schnorr-Müller et al. 2016) and was found to host an even more complex structure, but at the kilo-parsec scale: this includes rotation in the galaxy disc plane, a bipolar outflow from the AGN, non-circular motions along the nuclear bar, and an interaction between the bipolar outflow and the disc gas. Both objects thus resemble the well-known maser sources NGC 1068 and the Circinus galaxy, where water maser disc emission is coupled to jet or outflow maser radiation. This suggests a similar interpretation for NGC 5643 and NGC 3081 as well. Because the single-dish spectrum alone7 has a relatively low signal-to-noise ratio, it is not possible to infer a secure hypothesis on the nature of the maser in NGC 3081. The maser in NGC 5643 (Greenhill et al. 2003b, and MCP webpage) instead indicates redshifted (50–100 km s−1 with respect to the systemic velocity) emission that consists of a relatively broad feature with two or three peaks and might be due to a blending of features. Speculatively, the maser might then either be associated with a jet (a diffuse radio jet on either side of the nucleus is indeed visible in a high-sensitivity image obtained with the Very Large Array, Leipski et al. 2006) or with a rotating structure of which we only see the redshifted lines or the systemic lines when a large uncertainty in the reported target recessional velocity is accounted for.
As mentioned before, however, confident clues on the association of the maser emission with the AGN activity and on the maser nature of all six objects must await follow-up (interferometric) studies. In particular, all these maser sources, with the exception of ESO 103-G35 (∼460 solar luminosities), have moderate maser isotropic luminosities: the luminosities of four targets are only slightly higher than the paradigmatic threshold that separates kilo- and megamasers (35, 20, 17, and 13 solar luminosities for IGR J05081+1722, NGC 3783, NGC 3081, and NGC 5643, respectively), and one object, NGC 6300 (∼3.5 solar luminosities), is below that threshold. While this is still consistent with an outflow-related origin of the maser emission (Tarchi et al. 2011a discuss an analogous origin for the water maser detected in a sample of NLSy1 that has similar luminosities to ours), an association with star formation activity for these masers, especially for that in NGC 6300, cannot be ruled out a priori.
All Tables
All Figures
|
Fig. 1. Hard X-ray luminosity (20–100 keV) vs. redshift logarithm. Green dots represent the sources that are not observed at 22 GHz, blue stars are observed sources, and red open polygons are detected sources. Left panel: total sample of 380 AGN. Right panel: complete sub-sample of 87 AGN. |
| In the text | |
|
Fig. 2. Fraction of detected water maser emission vs. redshift limited to z < 0.04, X-ray column density in cm−2 (central panel), and 20–100 keV luminosity in ergs s−1 cm−2 (right panel). Blue starred points represent the total sample, and magenta polygons show the complete sub-sample. |
| In the text | |
|
Fig. 3. Logarithmic water maser luminosity vs. 20–100 keV (left panel) and 2–10 keV logarithmic luminosities (central panel), expressed in ergs s−1 cm−2. Water maser luminosity vs. the logarithmic X-ray column density in cm−2 (right panel). Empty magenta polygons are water maser detected sources, and blue arrows represent the upper limits to the water maser luminosity. |
| In the text | |
Current usage metrics show cumulative count of Article Views (full-text article views including HTML views, PDF and ePub downloads, according to the available data) and Abstracts Views on Vision4Press platform.
Data correspond to usage on the plateform after 2015. The current usage metrics is available 48-96 hours after online publication and is updated daily on week days.
Initial download of the metrics may take a while.