Free Access
Fig. 1.
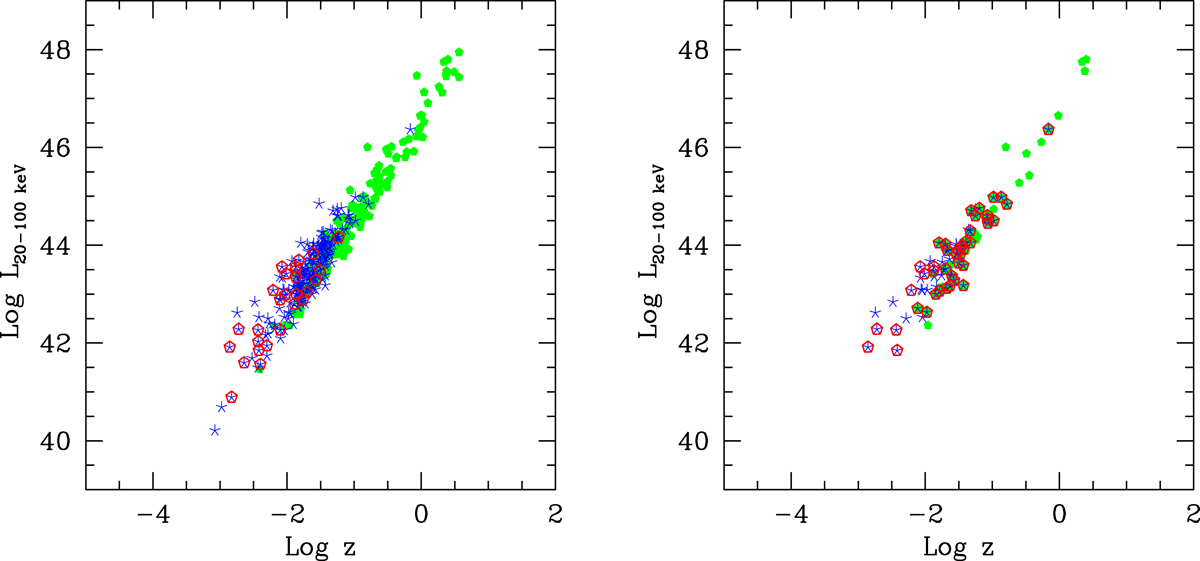
Hard X-ray luminosity (20–100 keV) vs. redshift logarithm. Green dots represent the sources that are not observed at 22 GHz, blue stars are observed sources, and red open polygons are detected sources. Left panel: total sample of 380 AGN. Right panel: complete sub-sample of 87 AGN.
Current usage metrics show cumulative count of Article Views (full-text article views including HTML views, PDF and ePub downloads, according to the available data) and Abstracts Views on Vision4Press platform.
Data correspond to usage on the plateform after 2015. The current usage metrics is available 48-96 hours after online publication and is updated daily on week days.
Initial download of the metrics may take a while.