Free Access
Fig. 2.
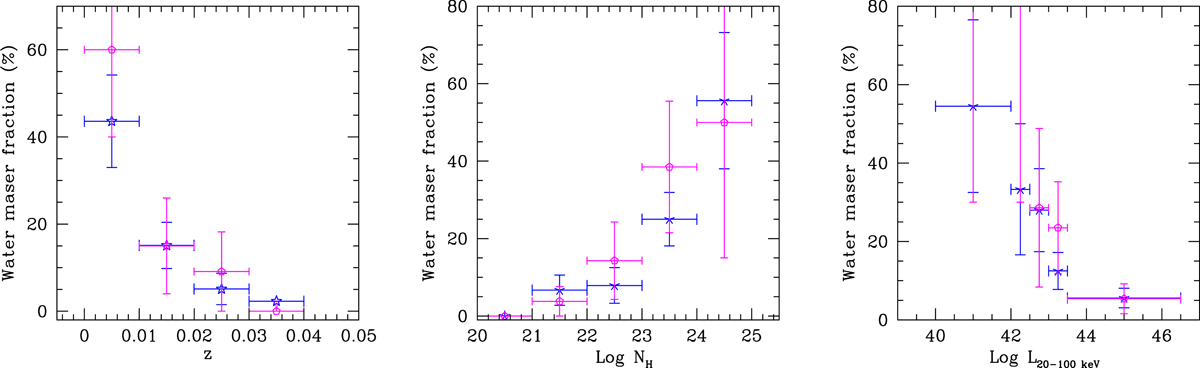
Fraction of detected water maser emission vs. redshift limited to z < 0.04, X-ray column density in cm−2 (central panel), and 20–100 keV luminosity in ergs s−1 cm−2 (right panel). Blue starred points represent the total sample, and magenta polygons show the complete sub-sample.
Current usage metrics show cumulative count of Article Views (full-text article views including HTML views, PDF and ePub downloads, according to the available data) and Abstracts Views on Vision4Press platform.
Data correspond to usage on the plateform after 2015. The current usage metrics is available 48-96 hours after online publication and is updated daily on week days.
Initial download of the metrics may take a while.