| Issue |
A&A
Volume 641, September 2020
|
|
|---|---|---|
| Article Number | A124 | |
| Number of page(s) | 8 | |
| Section | Extragalactic astronomy | |
| DOI | https://doi.org/10.1051/0004-6361/201935755 | |
| Published online | 18 September 2020 | |
Etching glass in the early Universe: Luminous HF and H2O emission in a QSO-SMG pair at z = 4.7⋆
1
Sorbonne Université, CNRS UMR 7095, Institut d’Astrophysique de Paris, 98bis bvd Arago, 75014 Paris, France
e-mail: This email address is being protected from spambots. You need JavaScript enabled to view it.
2
European Southern Observatory, Ave. Alonso de Córdova 3107, Vitacura, Santiago, Chile
3
National Radio Astronomy Observatory, 520 Edgemont Road, Charlottesville, VA 22903, USA
4
Laboratoire de Physique de l’ENS, École Normale Supérieure, Université PSL, CNRS, Sorbonne Université, Université Paris-Diderot, Paris, France
Received:
23
April
2019
Accepted:
30
March
2020
Abstract
We present ALMA observations of hydrogen fluoride, HF J = 1–0, water, H2O (220–211), and the 1.2 THz rest-frame continuum emission from the z = 4.7 system BR 1202-0725. System BR 1202-0725 is a galaxy group consisting of a quasi-stellar object (QSO), a sub-millimeter galaxy (SMG), and a pair of Lyα emitters. We detected HF in emission in the QSO and possibly in absorption in the SMG, while water was detected in emission in both the QSO and the SMG. The QSO is the most luminous HF J = 1–0 emitter that has yet been found and has the same ratio of HF emission-line to infrared luminosity, LHF/LIR, as a small sample of local active galactic nuclei and the Orion Bar. This consistency covers about ten orders of magnitude in LIR. Based on the conclusions of a study of HF emission in the Orion Bar and simple radiative transfer modeling, the HF emission in the QSO is excited either by collisions with electrons (and H2) in molecular plasmas irradiated by the AGN and intense star formation, or predominately by collisions with H2, with a modest contribution from electrons, in a relatively high temperature (∼120 K), dense (∼105 cm−3) medium. The high density of electrons necessary to collisionally excite the HF J = 1–0 line can be supplied in sufficient quantities by the estimated column density of C+. Although HF should be an excellent tracer of molecular outflows, we found no strong kinematic evidence for outflows in HF in either the QSO or the SMG. From a putative absorption feature in HF observed against the continuum emission from the SMG, we conducted a bootstrap analysis to estimate an upper limit on the outflow rate, Ṁoutflow ≲ 45 M⊙ yr−1. This result implies that the ratio of the molecular outflow rate to the star formation rate is Ṁoutflow/SFR ≲ 5% for the SMG. Both the QSO and the SMG are among the most luminous H2O (220–211) emitters currently known and are found to lie along the same relationship between LH2O (220 − 211)/LIR and LIR as a large sample of local and high-redshift star-forming galaxies. The kinematics of the H2O (220–211) line in the SMG is consistent with a rotating disk as found previously but the line profile appears broader than other molecular lines, with a full width at half maximum of ∼1020 km s−1. The broadness of the line, which is similar to the width of a much lower resolution observation of CO(2-1), may suggest that either the gas on large scales (≳4 kpc) is significantly more disturbed and turbulent due either to interactions and mass exchange with the other members of the group, or to the dissipation of the energy of the intense star formation, or both. Overall however, the lack of significant molecular outflows in either source may imply that much of the energy from the intense star formation and active galactic nucleus in this pair is being dissipated in their interstellar media.
Key words: galaxies: high-redshift / galaxies: groups: individual: BR 1202-0725 / quasars: emission lines / galaxies: evolution / galaxies: starburst
We are referring to the ability of hydrofluoric acid, a solution of water and hydrogen fluoride, to etch glass.
© M. D. Lehnert et al. 2020
 Open Access article, published by EDP Sciences, under the terms of the Creative Commons Attribution License (https://creativecommons.org/licenses/by/4.0), which permits unrestricted use, distribution, and reproduction in any medium, provided the original work is properly cited.
1. Introduction
The evolution of galaxies is driven by the balance of energy and mass within a baryonic gas cycle. The factors that maintain this balance are the rates of gas accretion from the cosmological web and mergers, the angular momentum of the accreted gas, the star formation efficiency, and outflows driven by starbursts and active galactic nuclei (AGN; e.g., Lehnert et al. 2015). Simulations of galaxies, especially high mass galaxies, suggest that a strong energy injection into the interstellar and circum-galactic media (ISM and CGM) is necessary to keep galaxies from growing overly massive, to ensure they have the correct age distribution of stellar populations, and to enable them to form the proper ratio of spiral and lenticulars as a function of redshift (e.g., Scannapieco & Oh 2004; Dubois et al. 2016; Habouzit et al. 2017; Beckmann et al. 2017). Numerous studies have shown ample evidence for outflows from both galaxies with high star formation surface densities (star formation rates per unit area; Heckman et al. 1990; Lehnert & Heckman 1996; Beirão et al. 2015) and AGN (e.g., Crenshaw & Kraemer 2012; Cicone et al. 2015; Tombesi et al. 2015). However, outflows are only one possible manifestation of starburst- or AGN-driven feedback.
Given the potential importance of feedback – the self-regulating gas cycle through which galaxies and AGN limit their own growth – it is important to understand what processes drive feedback and how the energy and momentum from young stellar populations and AGN is distributed and dissipated within the phases of the ISM and CGM (see, e.g., Guillard et al. 2015; Gray & Scannapieco 2017; Appleton et al. 2018; Buie et al. 2018, and references therein). Understanding how the energy and momentum is distributed in bulk flows versus turbulence in gas, for example, provides insights into how feedback actually works in regulating galaxy and black hole growth. To further our understanding of the physics underlying the gas cycle in galaxies, especially outflows and dissipation of energy generated by AGN and intense star formation, we used the Atacama Large sub/Millimeter Array (ALMA) to observe the galaxy group BR 1202-0725 at z = 4.69 (Omont et al. 1996; Ohta et al. 1996) in the HF J = 1–0 and para-H2O (220–211) lines, whose rest frequencies are sufficiently close to be observed in a single tuning.
BR 1202-0725 is a well-studied, unlensed group composed of a quasi-stellar object (QSO), a sub-millimeter galaxy (SMG; McMahon et al. 1994; Smail et al. 1997), and two Lyα emitters (LAEs; e.g., Hu et al. 1996). Both the QSO and SMG are very luminous IR emitters, ∼1013 L⊙, and the system has been observed in a wide range of molecular and atomic lines (Omont et al. 1996; Benford et al. 1999; Salomé et al. 2012; Carilli et al. 2013; Lu et al. 2017a, 2018, and references therein). Based on an excess in the wing of the line profile of [CII], Carilli et al. (2013) estimated an outflow rate in the atomic gas from the QSO of Ṁout ∼ 80 M⊙ yr−1 and concluded that the gas depletion time due to this outflow is ∼600 Myrs, a factor of ≳10 longer than the gas consumption time due to star formation. For the SMG, no outflows were inferred and the [CII] velocity field was interpreted as a rotating disk. The low speed of the QSO outflow, a few 100 km s−1, its low mass ejection rate, and the lack of outflow in the SMG are very surprising given that we expect QSOs to have fast winds, and starbursts that form stars at greater than 1000 M⊙ yr−1 to have vigorous outflows. If neither the QSO and SMG are driving outflows, then perhaps the energy from the intense star formation or from the luminous AGN is being rapidly dissipated. Due to its nature, HF J = 1–0 is a good tracer of molecular outflows and H2O traces dissipation in molecular gas. When observed together, they enhance our understanding of dissipation and the relative importance of outflows in BR 1202-0725 in particular, and QSOs and SMGs generally.
Hydrogen fluoride1 has a large Einstein A coefficient and high critical density, ∼109 cm−3, implying that most of the HF gas lies in its ground rotational state (Gerin et al. 2016). As a result, the 1–0 line is generally observed in absorption in the Milky Way and other galaxies (Neufeld et al. 1997, 2005, 2010; Rangwala et al. 2011; Monje et al. 2011a,b, 2014; Kamenetzky et al. 2012; Pereira-Santaella et al. 2013; Sonnentrucker et al. 2015; Pérez-Beaupuits et al. 2018). In some sources, such as the Orion Bar and nearby galaxies hosting AGN, HF is observed in emission (van der Werf et al. 2010; van der Tak et al. 2012; Pereira-Santaella et al. 2013; Lu et al. 2017b; Kavak et al. 2019). Little is currently known about HF emission or absorption in high redshift galaxies (one is a detection in absorption and the other, only an upper limit; see Monje et al. 2011b; Lis et al. 2011).
Hydrogen fluoride is a robust molecule, representing the vast majority of the fluorine (F) in the cool atomic and molecular phases of the ISM. F reacts exothermically with H2, so it rapidly forms HF (Neufeld & Wolfire 2009). We note that the formation of HF through a reaction between F and H2 has a moderate activation energy, Eact/k ∼ 500 K, but the reaction rate is enhanced at low temperatures via quantum tunneling (Neufeld et al. 2005). HF is photo-dissociated only by photons with λ < 1120 Å, which means it is a robust molecule and shielded even in relatively low column dusty neutral clouds, although it can be destroyed by reactions with C+ (Neufeld & Wolfire 2009). These characteristics mean that HF is a sensitive probe of molecular gas columns over a wide range of extinctions and densities, even in diffuse clouds (AV < 0.5 magnitudes; Neufeld et al. 2005) and because it traces the total H2 column, it is likely to be a sensitive probe of even weak molecular outflows (and inflows; e.g., Monje et al. 2014). It is only in dense, nH2≳105 cm−3, cold, Tgas ≲ 20 K, molecular gas that HF may not be a good tracer of the total molecular gas column due to adsorption onto grains (“freeze-out”; e.g., Neufeld et al. 2005; van der Wiel et al. 2016). HF J = 1–0 is not a good tracer of turbulent dissipation (Godard et al. 2014).
Water is one of the main carriers of oxygen, after CO, in warm and cold molecular gas. Para-H2O (220–211) is a relatively low excitation line, with an upper energy level, Eup = 195.9 K. It has been detected in a significant number of low- and high-redshift galaxies with a wide range of infrared luminosities (Yang et al. 2013, 2016, and references therein). In contrast to CO, H2O is not a good tracer of photon-dominated regions (PDRs), because it is easily photo-dissociated by UV radiation. Generally speaking, analyses of sources in which multiple transitions of H2O have been observed, find that the excitation of H2O is consistent with pumping by the infrared (IR) radiation field (González-Alfonso et al. 2012, 2014). The intense radiation field necessary to IR pump the water vapor emission may lead to an increase in the gas phase abundance of water by sublimation of the icy mantles of dust grains. This increase in abundance may explain the high luminosities, which are generally beyond what is expected for PDR and IR pumping if much of the water was not in the gas phase (González-Alfonso et al. 2012, 2014). Other processes, such as exposure to intense, hard UV and X-ray radiation fields or the dissipation of mechanical energy, may also heat the high column density gas, melting the mantles of grains and increasing the rate of the formation of H2O in the gas phase (e.g., Meijerink et al. 2012). In contrast to HF J = 1–0, H2O line emission is also a significant source of energy loss and dissipation through slow molecular shocks (vshock = 20–40 km s−1 and nH2 = 103 − 5 cm−3; Flower & Pineau des Forêts 2010; Appleton et al. 2013). Consistent with this, although the emission is predominantly energized by IR pumping, water lines in nearby and distant galaxies often show complex line profiles that generally have line widths consistent with other molecular species (González-Alfonso et al. 2012; Omont et al. 2013).
Our paper is organized as follows. In Sect. 2, we present the observations, reduction, and analysis; in Sects. 3 and 4, we present the results and discuss their implications. In our analysis, we use a luminosity distance of 4.56 × 10⁴ Mpc and a physical scale of 6.8 kpc arcsec−1.
2. Observations and data reduction
Our ALMA Cycle 3 observations in Band 6 were carried out on 2016 March 5 for 77 min on-source integration time, with 36 antennas in the C36-3 configuration. The four 1.875 GHz spectral windows were tuned to cover the frequency ranges 213–217.4 GHz and 228–232.5 GHz. The quasars, J1159-0940 and J1229+0203, were used to calibrate the complex gains and bandpass. The coverage of the visibility data in the u − v plane was well covered with baselines with lengths of 15 m–640 m. The source was observed at elevations of 58–77° and the weather was stable with precipitable water vapor, PWV = 1.6–2.2 mm.
We used the supplied calibration script and Common Astronomy Software Applications (CASA; McMullin et al. 2007) to reduce the data. We imaged the phase calibrator and determined that the bandpass stability is accurate to ∼0.1%. To image the line data, we ensured that no unwanted features were introduced across the band by first subtracting the continuum model from the visibilities. This reduced the continuum emission by an order of magnitude. We then subtracted the low-level residuals of the continuum by fitting a straight line to the line-free channels in the visibility data. To image both the continuum and line emission, we used natural weighting, which resulted in a beam of 0 56 × 0
 49 with a PA = −74° (Fig. 1).
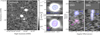 |
Fig. 1. Left: total intensity image of the 1.2 THz rest-frame continuum of both the QSO and SMG, along with Lyα emitter 2 in BR 1202-0725 The half power beam size of the data, 0 |


3. Results
Both the QSO and SMG are detected in the 1.2 THz rest-frame continuum, along with the Lyα emitter 2 (LAE2; Fig. 1). We detect HF J = 1–0 in emission from the QSO and H2O (220–211) in both the QSO and SMG (Fig. 2). The HF emission in the QSO is coincident with the continuum emission and is spatially unresolved. There is a weak absorption feature in the spectrum of the SMG over the velocity range ∼0 to −400 km s−1 relative to the expected velocity of HF. We associate this weak putative absorption with HF J = 1–0 (Sect. 4.2). The H2O emission is unresolved in the QSO, but it is resolved in the SMG (Fig. 1). The position-velocity (PV) diagram shows that the peak of the H2O emission shifts across ∼0.3″ or ∼2 kpc, consistent with the PV plot of [CII] (Carilli et al. 2013). Because of the large width of the H2O line in the SMG, the low frequency part of the profile falls past the edge of our bandpass and some of the emission is missing. Any potential H2O emission at the redshift of LAE2 (Carilli et al. 2013) would fall in the gap between the spectral windows.
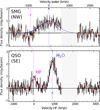 |
Fig. 2. Continuum-subtracted spectra of HF J = 1–0 and H2O (220–211) in BR 1202-0725. The black line are the data after being Hanning smoothed to a velocity resolution of 11 km s−1. The red line shows the data binned into six channels and subsequently Hanning smoothed to a velocity resolution of 66 km s−1. Top: spectrum of H2O emission from the SMG. Indicated with the magenta dashed line is the velocity of the expected HF J = 1–0 feature, which may (at best) be tentatively detected, relative to the velocity of H2O. Bottom: spectrum of HF J = 1–0 and H2O (220–211) emission from the QSO. The zero-velocity of the QSO is derived from a Gaussian fit to the H2O profile of the QSO, resulting in z = 4.6948 ± 0.0001. The redshift of the SMG is assumed to be z = 4.6915 from Carilli et al. (2013). The Gaussian functions represented with a solid line are fits to the HF (magenta) and H2O (blue) emission, as summarized in Table 1. The Gaussian represented with the dotted brown line for the SMG is the fit to the [CII] line (Carilli et al. 2013). The horizontal axis on the bottom (top) gives the corresponding velocity centered on the HF (H2O) line, as indicated with the magenta (blue) dashed line. The light gray region indicates the gap in the spectra between the two spectral windows. |
Table 1 summarizes the properties of the QSO and SMG. The continuum properties are derived by fitting a point source to the unresolved 216 GHz continuum of both the QSO and SMG. LAE2 has a 216 GHz continuum flux density of 0.44 ± 0.06 mJy beam−1. The line properties are derived by fitting a Gaussian function to the H2O (220–211) and HF J = 1–0 lines. When we constrain the fit of the H2O (220–211) in the SMG to the redshift and width of the [CII] line from Carilli et al. (2013), we find two regions of residual emission in both the blue and red wing of the H2O profile. Both of these residuals have approximately Gaussian shapes and a best fit to each have full widths at half maximum (FWHM) of ∼240 ± 60 km s−1. The symmetry of the line and the residuals seems to rule out significant emission from HF in the wing of the H2O (220–211) line. Taken at face value, our results suggest that the water emission is significantly broader than the other emission lines detected so far (cf. 1020 km s−1 for H2O (220–211) versus 720 km s−1 for the [CII], CO(5–4), and CO(7–6) lines; Salomé et al. 2012; Carilli et al. 2013). We note that one observation, that of the CO(2–1) line with a beam of 2 75 × 1
 73, has a CO(2–1) line FWHM comparable to the one we have estimated for the H2O (220–211) line (Jones et al. 2016). However, when we compare all of the line widths of CO(2–1) with restoring beam sizes of ≲0
 6 from Jones et al. (2016), we find the weighted average FWHM = 705 km s−1. This implies that the most extended CO(2–1) emission has a larger line width.
Characteristics of the dust continuum and the H2O and HF emission lines in BR 1202-0725.
In contrast, the line width of the H2O (220–211) in the QSO is, within the uncertainties, exactly the same as for the other lines. Neither the QSO or the SMG show clear evidence for an outflow in the H2O line, although there is a possible excess in the line profile of the QSO seen ∼400 km s−1 blueward of the systemic H2O redshift, consistent with the velocities of the weak [CII] outflow (Carilli et al. 2013).
4. Discussion
4.1. HF: Molecular gas irradiated by AGN and young stars
The detection of HF emission in the QSO is unusual. In most of the sources observed thus far, the HF J = 1–0 line is observed as an absorption line with little or no emission (van der Werf et al. 2010). Only a handful of sources are known to have HF purely in emission, without any obvious associated absorption. These sources are the Orion Bar (van der Tak et al. 2012; Kavak et al. 2019), Mrk 231 (van der Werf et al. 2010), and a few nearby galaxies (Pereira-Santaella et al. 2013; Lu et al. 2017b). To increase the number of galaxies observed with HF in emission, we extracted the HF emission line fluxes from local galaxies observed with Herschel in the sample of Yang et al. (2013), which all host AGN. We find that the galaxies that host AGN and the QSO in BR 1202-0725 have an approximately constant ratio of LHF/LIR irrespective of LIR (Fig. 3). We note, however, that the exact slope of the relation only considering the local AGN and QSO is dependent on the far-infrared luminosity used. Other estimates of the infrared luminosity of the QSO in the literature would lower LIR/LHF (cf. Salomé et al. 2012; Wagg et al. 2014; Lu et al. 2017a).
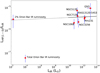 |
Fig. 3. Relationship between the infrared luminosity and the ratio of the HF luminosity and infrared luminosity of BR 1202-0725, a sample of local AGN (Yang et al. 2013), and the Orion Bar (Salgado et al. 2016; Nagy et al. 2017). All sources are labeled. We show a least-squares fit to the local AGN, QSO, and the Orion Bar (black line with the dotted line extension to the Orion Bar), which implies the ratio is constant. We note that fitting the AGN and QSO only yields a similar fit but with a slightly steeper slope. For comparison, we show the ratio LHF/LIR for the entire IR luminosity of the Orion Bar and the luminosity if only 2% of the total IR luminosity is within the Herschel beam used to measure the HF flux (see text for details). |
The Orion Bar is the only known galactic source or sight-line where HF appears purely in emission (although we note that the absorption of HF and the nearby H2O (220–211) could mask any emission in other galactic and extra-galactic sources; see e.g., Monje et al. 2014; Neufeld et al. 2010; Sonnentrucker et al. 2015). If we compare LHF/LIR and LIR for the Orion Bar (Salgado et al. 2016; Nagy et al. 2017), we find that its LHF/LIR lies over an order of magnitude below. However, the beam over which the HF flux is extracted from the Orion Bar region only subtends ∼2% of the projected area of the 250 μm flux in the Orion Bar (cf. Salgado et al. 2016). If we scale the IR luminosity of the Orion Bar by this factor, we find that it has approximately the same ratio as the QSO in BR 1202-0725 and the other AGN in our sample. However, the beam used to measure the HF J = 1–0 flux does not subtend a simple geometric projection of the flux at 250 μm and thus our estimate of 2% may be too low by a factor of approximately two.
In their analysis of the HF emission in the Orion Bar, van der Tak et al. (2012) found that collisions with electrons was the likely excitation mechanism, requiring ne− ∼ 10 cm−3. This high electron density in the molecular gas, and the fact that at the time the other source known to have HF emission was Mrk 231, led them to speculate that other AGN would have HF in emission. We confirm this speculation and suggest that the constant ratio of LHF/LIR in such sources that we observe simply reflects the high intensity of energetic photons that the AGN and intense star formation provide, raising the electron density and perhaps excitation temperature in the molecular gas to levels necessary to excite HF emission (van der Tak et al. 2012; Kavak et al. 2019).
To understand why the QSO in BR 1202-0725 has a similar LHF/LIR as the Orion Bar, we estimated the UV photon densities. Considering the combined contributions from the AGN and star formation for the QSO and the star formation for the SMG, we estimate a non-ionizing radiation intensity of > 300 G0 and ∼520 G02. The non-ionizing radiation intensity is ∼104G0 in the Orion Bar (Hogerheijde et al. 1995), about an order of magnitude higher than the SMG and the lower limit for the QSO. Similarly, we find that for the QSO (SMG), the density of ionizing photons is ≳900 cm−3 (∼200 cm−3), assuming all the ionizing photons have an energy of 13.6 eV. Using the results from O’Dell et al. (2017), the ionizing photon density in the Orion Bar is ∼60 cm−3. In the QSO, the AGN is about a factor of four more luminous in its ionizing radiation than that due to its star formation, and likely has a much harder radiation field. The globally large ionizing photon intensity and the likely high G0 in the QSO implies that there is sufficient photon intensity in the diffuse molecular gas to maintain a high electron density. This agreement may be fortuitous given the crudeness of our estimate. We certainly cannot rule out the (likely) contribution from X-rays and cosmic rays in ionizing and heating the HF J = 1–0 emitting regions. Both X-rays and cosmic rays may be necessary to penetrate deeply enough to provide a sufficient volume of HF J = 1–0 emitting gas to explain the strength of the HF J = 1–0 line.
To investigate the similarity of the QSO HF J = 1–0 emission to that of the Orion Bar, we used the code RADEX (van der Tak et al. 2007)3 to constrain the column density and excitation of the HF J = 1–0 line. We tried a variety of models to explain the brightness temperature of the HF emission, including ones used previously to model the CO emission in BR 1202-0725 (Salomé et al. 2012). To make an estimate of the peak temperature of the emission, we assumed that the source size was that of the beam of the ALMA observations of BR 1202-0725. If we used the high angular resolution that was obtained of the dust continuum, ∼0 3 (Salomé et al. 2012), it would increase the brightness temperature by about a factor of three. The estimated temperature of the dust continuum is about 43 K (Salomé et al. 2012). The model parameters that give the appropriate brightness temperature are the ones close to those used in van der Tak et al. (2012), namely, the column density, N(HF) = 1015 cm−2, the number density of molecular hydrogen, nH2 = 105 cm−3, the excitation temperature, Tgas = 43 K, background cosmic microwave background temperature, Tbg = 15.5 K, and an electron number density, ne− = 10 cm−3. In these calculations, we assume a turbulent velocity dispersion of 5 km s−1 as observed in the Orion Bar (van der Tak et al. 2012; Nagy et al. 2017). If we assume a higher velocity dispersion, the column density necessary to explain the strength of the HF J = 1–0 emission would increase proportionally. If we use the dust continuum size, 0
 3, then the brightness temperature is best explained with a higher excitation temperature, Tgas = 100 K. The high excitation temperature is the same as that used to model the HF J = 1–0 emission for a region in the Orion Bar (van der Tak et al. 2012). Consistent with this possible higher excitation temperature for a more compact emission in the QSO, recently Kavak et al. (2019) found that the HF J = 1–0 emission in the Orion Bar is consistent with a higher excitation temperature, Tgas∼120 K, and a molecular density, 105 cm−3. With this density and temperature, the excitation of HF J = 1–0 is dominated by collisions with H2 with only a modest contribution to the excitation from electrons of about 15%. We also find that this could explain the HF emission in the BR 1202-0725 QSO but only if the HF emitting region is compact. Future high resolution observations can test whether this is the case.
Thus it appears that perhaps the regions of molecular gas in the QSO host galaxy are similar to that in the Orion Bar, but on a much larger scale. The total line width of the HF J = 1–0 line, since it is very similar to the other relatively large number of molecular and atomic lines observed in BR 1202-0725, is due to a large number of individual clouds orbiting within the gravitational potential of the QSO host galaxy.
There are other mechanisms that could potentially excite HF emission that are not considered in the radiative transfer modeling, including near-IR pumping and residual energy from the formation of HF molecules (“chemical pumping”; van der Tak 2012; Godard & Cernicharo 2013). However, the radiation field intensities of 1000–105 times the interstellar radiation field would only increase the population of the J = 1 of HF by a small amount (Godard & Cernicharo 2013). The impact of chemical pumping is more difficult to estimate given the limited constraints we have on the radiation field impinging on and the density distribution of the HF-bearing molecular gas (van der Tak 2012). Assuming an equilibrium between the formation and destruction of HF (see van der Tak 2012, for details), we estimated the required column of molecular gas necessary to explain the strength of the HF J = 1–0 line emission in the BR 1202-0725 QSO. We find that the total molecular column density, NH2, must be ≳1024 cm−2 to explain the total column density of HF in the J = 1 rotational level. The necessary column density of molecular gas is well above that estimated in Salomé et al. (2012) based on radiative transfer modeling of the strengths of several CO lines (and what we estimate in the following). Thus we can rule out a significant contribution by chemical pumping to the excitation of HF.
Electron densities are an important factor in connecting the Orion Bar and our observations of the QSO in BR 1202-0725. This is because collisions with electrons is a potentially important mechanism for exciting HF J = 1–0 emission and whose importance depends on the precise excitation temperature of the gas (cf. van der Tak et al. 2012; Kavak et al. 2019). The electron fraction is 10−4 from the RADEX modeling. To check if that is a plausible value, we used RADEX to model the brightness temperature of the [CII]λ 158 μm line (Carilli et al. 2013). We find that the brightness temperature of the [CII] can be explained by a similar model to that used to explain the strength of the HF line, but with a lower excitation temperature, Tex = 55 K, and a column density, N(C+) = 4 × 1018 cm−2. Except for Tex, which is about a factor of two smaller (and about that used to model the CO emission in Salomé et al. 2012, namely a dust temperature of 43 K), these parameters are almost identical to those found by van der Tak et al. (2012) to model the Orion Bar. We note that since the [CII] line is optically thick, increasing the column does not increase the brightness temperature. The only way to do that is to increase the excitation temperature. If the C+ to H2 density ratio is about 10−4 (consistent with the solar abundance of C), then, as expected in models of PDRs, C would be able to supply the necessary density of electrons in the low extinction regions of the PDRs in the QSO. At higher columns, cosmic rays (and to a much less extent, turbulent dissipation) may also increase the electron densities (Meijerink & Spaans 2005; Meijerink et al. 2011; Godard & Cernicharo 2013).
HF is thought to be an excellent tracer of the total H2 gas column density since it probes molecular gas even at relatively low levels of extinction (Neufeld et al. 2005; Neufeld & Wolfire 2009). However, to estimate the total molecular column density from HF we need to know the relative abundance of HF in the molecular gas. The reaction of F with molecular hydrogen is exothermic and thus needs no energy source to facilitate its formation (Gerin et al. 2016, and references therein). Thus, we expect that almost all of the fluorine is in the form of HF in the molecular gas, as observed in other sources. If we make that assumption and further assume that the abundance of fluorine is solar (relative abundance, F/H = 3.6 × 10⁻⁸; Asplund et al. 2009), then the total molecular column is ∼1022 cm−2. Interestingly, assuming the same for the carbon abundance (C/H = 2.69 × 10⁻⁴; Asplund et al. 2009) results in a similar total molecular column density (see the CO column density estimates given in Salomé et al. 2012).
While this agreement could be fortuitous, it is consistent with the gas being metal enriched, but moreover suggests that fluorine was produced rapidly. Although uncertain, models of fluorine production and observations suggest that the majority of the F is produced in massive stars and a significant fraction may also be produced in low to intermediate mass stars in their asymptotic branch phase of evolution (Renda et al. 2004; Cunha et al. 2008; Abia et al. 2010, 2011, 2015; Prantzos et al. 2018). The production of F peaks in AGB stars with ∼2 M⊙ and is produced in stars with masses over the range ∼1–3 M⊙ (Lugaro et al. 2008). The evolutionary time for stars to become AGB stars over this mass range is ∼0.6–2 Gyr. The age of the universe is only ∼2 Gyr at the redshift of BR 1202-0725. How the fluorine abundance was enhanced given the evolutionary timescale of the stars that produce a significant fraction of the F is an interesting questions. That the production of fluorine relies on the abundance of oxygen and nitrogen is also of note. More observations are needed to constrain the abundance of F in galaxies in the early universe in order to understand what our observations imply about fluorine nucleosynthesis.
4.2. Possible detection of HF in absorption in the spectrum of BR 1202-0725 SMG
HF J = 1–0 is frequently observed in absorption (Monje et al. 2011a,b, 2014; Sonnentrucker et al. 2015) and since it probes the total column of molecular gas over a wide range of extinctions and densities, it is an excellent probe of outflowing molecular gas (Monje et al. 2014). Therefore, if either the QSO or SMG were driving outflows, we would expect to see strong broad HF absorption. The spectrum of the SMG shows possible absorption over the velocity range of about 0 to −400 km s−1 relative to the systemic velocity for the HF J = 1–0 line (Fig. 2). The significance of this feature is not high, but if real, its characteristics are what we would expect to observe if the SMG was driving an outflow. To assess the significance of this feature, its column density, and mass outflow rate, we analyzed it via a bootstrap method assuming it is HF in absorption. We did 1000 realizations of the data by binning the unsmoothed data by a factor of ten to a velocity sampling of 60 km s−1. We estimated the standard deviation of the channels within each bin and used this as the distribution of the uncertainty in the flux density of each binned channel. We converted all of the flux densities in each channel to optical depths, multiplied by the channel width, and summed the resulting depths over the velocity range 0 to −400 km s−1. For these estimates, we assumed that all of the HF was in the ground state, which given the nature of HF is reasonable. In this case, the optical depth is simply τ = −ln(Fline/Fcontinuum). Using the relation from Neufeld et al. (2010), we estimated the integrated column density for each realization.
In addition, we calculated the outflow rates based on each estimated column density. To estimate the outflow rates, we used the relation for an expanding wind with an opening angle of π sr (e.g., Heckman et al. 1990; Lehnert & Heckman 1996), Ṁwind = πmH2 N(H2) VwindRwind, where mH2 and N(H2) are the mass and column density of molecular hydrogen respectively, Vwind is the terminal velocity of the wind (which we assume to be 400 km s−1), and Rwind is the injection radius of the wind (which we assume to be the half beam size of the ALMA data). This relation assumes the outflow is steady and launched at radius, Rwind, with terminal velocity, Vwind. To convert between the column density of HF and H2, we assumed an abundance of HF as inferred in the Orion Bar, 3.5 × 10⁻⁸ (van der Tak et al. 2012). From this analysis, we find that 95% of the estimated values for the column density of HF and the mass outflow rates are N(HF) ≲ 4 × 1013 cm−2 and Ṁwind ≲ 45 M⊙ yr−1. The star formation rate of the QSO is ∼103 M⊙ yr−1 (Salomé et al. 2012). Thus the wind efficiency of only the star formation is Ṁwind/SFR ≲ 5%. This is much less than typically found in starburst and AGN host galaxies (Fluetsch et al. 2019).
There are several caveats that we need to recognize in estimating the upper limit of the outflow rates. We assume that the fluorine abundance is solar (i.e., similar to that inferred for the Orion Bar). If it is much less, than the upper limit in the molecular outflow rate would be proportionally higher. We also do not know the launch radius of any potential outflow in the BR 1202-0725 SMG and have simply assumed the ALMA beam size. If the source is much more compact, the limits will be proportionally lower. To observe the HF J = 1–0 line in absorption, it must be viewed against the thermal dust continuum and therefore the dust continuum size is appropriate for the launch radius.
There are also perhaps two more mundane explanations for not observing strong absorption in the SMG of BR 1202-0725. The first is that the HF molecules could be in equilibrium with the thermal radiation field. In this case, there would be no emission or absorption. If the molecular gas has a low density, sufficiently low such that collisional excitation of HF is not important, being in equilibrium with the radiation field implies that the rate of absorption of the thermal continuum is equal to spontaneous and stimulated emission. Assuming a detailed balance and a radiation field temperature of 43 K, we find that the radiation intensity necessary at the frequency of HF J = 1–0 is over two orders of magnitude greater than that observed. An alternative and perhaps plausible explanation could be that the SMG is driving a wind but we are observing a disk edge-on. In an edge-on disk, there is no bright continuum emission against which the outflowing gas is superposed and therefore no absorption is observed. Any emission is likely too faint to be detected as the inner regions would be swamped by the thermal emission from the disk. A similar effect is observed in nearby galaxies in the Na D absorption lines in the optical whereby as a disk galaxy becomes more edge-on to the line of sight, the Na D absorption is dominated by gas in the ambient ISM and not by gas from an outflow (Heckman et al. 2000). This last possibility can be tested with higher resolution observations to determine the morphology and axial ratio of the dust continuum, as well as the kinematics of the SMG, to determine whether it is an approximately edge-on rotating disk.
4.3. H2O: IR-pumping and energy dissipation
We find that the QSO and SMG lie above a relation between the LH2O (220 − 211)/LIR and LIR with a slope of 0.19 ± 0.02 (Fig. 4; see Yang et al. 2013, and also Liu et al. 2017). Yang et al. (2013) found a best fitting slope for the relationship between LH2O (220 − 211) and LIR that is consistent with what we find, which is not surprising given we are using the same data and only including two additional points. The high LH2O (220 − 211)/LIR of both the QSO and SMG of BR 1202-0725 indicate that they are among the most, if not the most, luminous emitters of H2O (220–211) currently known. The relationship between LH2O (220 − 211) and LIR is consistent with IR pumping of the water lines (González-Alfonso et al. 2014; Yang et al. 2013, 2016). The water abundance is estimated to be an order of magnitude higher for galaxies that lie along the relationship between LIR and water luminosity (∼10−6; González-Alfonso et al. 2010) than the water abundance in the Orion Bar (< few 10−7; Habart et al. 2010; Nagy et al. 2017). The H2O (220–211) line is not detected in the Orion Bar (e.g., Nagy et al. 2017). The small slope of the LH2O (220 − 211)/LIR–LIR relation may suggest that the gas-phase abundance of water also increases as the IR luminosity increases.
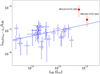 |
Fig. 4. Relationship between the infrared luminosity, LIR, and the ratio of the LH2O (220 − 211) and LIR of BR 1202-0725 (red hexagons) and for a sample of local galaxies (blue hollow squares Yang et al. 2013). We show a least-squares fit to all galaxies (blue line, slope of 0.19 ± 0.02). To make the estimates for the QSO and SMG, we used the infrared luminosities from Salomé et al. (2012). Other estimates from the literature are a few times higher (Wagg et al. 2014; Lu et al. 2018) and would yield values that have greater consistency with the best fit shown in the figure. |
However, the water line in the SMG appears broader than the lines of the other dense gas tracers (about 40% wider; Salomé et al. 2012). Jones et al. (2016), analyzing observations of BR 1202-0725 with the Jansky Very Large Array, found that the CO(2–1) line width at beam sizes ≲0 6 was roughly constant at ∼700 km s−1 (see also Salomé et al. 2012). When they analyzed the data with a restoring beam size of 2
 6 × 1
6 × 1 7, the CO(2–1) FWHM increased to ∼1050 km s−1 or similar to what we estimate for the H2O (220–211) line. Since our beam is about 0.5 arcsec, we would expect the line to have a FWHM of ∼700 km s−1, especially given that the H2O (220–211) emission is not spatially resolved. Thus it could also be that the line widths of different tracers become larger at larger scales. The water-emitting gas could also be more sensitive to the specific process or processes that are causing the line width to increase with increasing size of the restoring beam size (see Jones et al. 2016, for details).
There are several plausible explanations for this effect with decreasing spatial resolution. The detection of broader lines with decreasing resolution may indicate that the rotation curve is rising on scales larger than about 0 5 (∼3.4 kpc at the redshift of BR 1202-0725). Unlike HF J = 1–0, water emission also traces dissipation in slow molecular shocks (Flower & Pineau des Forêts 2010). In the SMG, there could be mechanical energy dissipation causing emission in addition to (the dominant excitation mechanism) IR-pumping, consistent with the broad line observed in the water line and its high luminosity. The SMG, despite having about half the IR luminosity of the QSO (Jones et al. 2016), is 40% brighter in H2O (220–211) (see Omont et al. 2013; Yang et al. 2013, for analyses suggesting that star-forming galaxies hosting AGN have less luminous water emission). BR 1202-0725 is an interacting system with evidence of a bridge of gas connecting the QSO and SMG (Carilli et al. 2013). Such an interaction and potentially significant gas mass exchange between the two galaxies would excite gas and induce complex kinematics, perhaps preferentially on large scales (see discussion in Emonts et al. 2015). Moreover, if the kinematics and luminosity of the water lines are related to the dissipation of energy in the interstellar media of the SMG, it may explain why we observe only relatively weak outflows; much of the mechanical energy generated by the intense star formation is not contributing to driving outflows, but is being dissipated in the dense molecular gas. All of these processes – infrared pumping, turbulent dissipation of the mechanical energy from the young stars, the transfer of mass from or to the QSO, or even outflows – may be contributing to exciting the broad water emission in the SMG. Unfortunately, the source of this energy to support the large line width on large scales, or the underlying cause of the high H2O (220–211) luminosity are not constrained by our data. Observations of additional water lines and other tracers of dissipation in dense molecular gas such as CH+, SH+, and rotational levels of H2 (Godard et al. 2014) at a variety of spatial resolutions will be necessary to substantiate any of these various hypotheses.
Campbell & Walker (1979) and Walker (2012) provide a discussion of the use and dangers of using HF (which can etch and dissolve glass) in an astronomical observatory to estimate stellar radial velocity variations.
To make this estimate, we used the star formation rates (from LIR, which was estimated over the wavelength range of 20–1000 μm; Salomé et al. 2012), the UV continuum slope, the flux density at 1550 Å for continuous star formation at an age of 5 Myrs estimated using Starburst99 (Leitherer et al. 1999), and the radius of the continuum emission from our study for the QSO (an upper-limit) and the 44 GHz size for the SMG (Jones et al. 2016). For the non-ionizing radiation from the QSO itself, we used the estimate of the 1450 Å continuum flux density and the continuum slope from Carniani et al. (2013). In all estimates of the non-ionizing continuum, we integrated the scaled UV continua from 6 to 13.6 eV. The estimate for the QSO is lower than that for the SMG due to the larger size used to estimate the intensities in the QSO compared to the SMG.
Acknowledgments
MDL wishes to thank Nikos Prantzos for interesting discussions on the nucleosynthetic origin of fluorine. This paper makes use of the following ALMA data: ADS/JAO.ALMA #2015.1.01489.S. ALMA is a partnership of ESO (representing its member states), NSF (USA), and NINS (Japan), together with NRC (Canada), MOST and ASIAA (Taiwan), and KASI (Republic of Korea), in cooperation with the Republic of Chile. The Joint ALMA Observatory is operated by ESO, AUI/NRAO, and NAOJ. The National Radio Astronomy Observatory is a facility of the NSF operated under cooperative agreement by AUI. CY acknowledges support from an ESO Fellowship. EF acknowledges support from the European Research Council in the form of the Advanced Grant MIST (FP7/2017-2022, No. 742719). We thank the anonymous referee for their constructive comments that helped us to improve this manuscript.
References
- Abia, C., Cunha, K., Cristallo, S., et al. 2010, ApJ, 715, L94 [NASA ADS] [CrossRef] [Google Scholar]
- Abia, C., Cunha, K., Cristallo, S., et al. 2011, ApJ, 737, L8 [NASA ADS] [CrossRef] [Google Scholar]
- Abia, C., Cunha, K., Cristallo, S., & de Laverny, P. 2015, A&A, 581, A88 [NASA ADS] [CrossRef] [EDP Sciences] [Google Scholar]
- Appleton, P. N., Guillard, P., Boulanger, F., et al. 2013, ApJ, 777, 66 [NASA ADS] [CrossRef] [Google Scholar]
- Appleton, P. N., Diaz-Santos, T., Fadda, D., et al. 2018, ApJ, 869, 61 [NASA ADS] [CrossRef] [Google Scholar]
- Asplund, M., Grevesse, N., Sauval, A. J., & Scott, P. 2009, ARA&A, 47, 481 [NASA ADS] [CrossRef] [Google Scholar]
- Beckmann, R. S., Devriendt, J., Slyz, A., et al. 2017, MNRAS, 472, 949 [NASA ADS] [CrossRef] [Google Scholar]
- Beirão, P., Armus, L., Lehnert, M. D., et al. 2015, MNRAS, 451, 2640 [NASA ADS] [CrossRef] [Google Scholar]
- Benford, D. J., Cox, P., Omont, A., Phillips, T. G., & McMahon, R. G. 1999, ApJ, 518, L65 [NASA ADS] [CrossRef] [Google Scholar]
- Buie, E., II, Gray, W. J., & Scannapieco, E. 2018, ApJ, 864, 114 [CrossRef] [Google Scholar]
- Campbell, B., & Walker, G. A. H. 1979, PASP, 91, 540 [NASA ADS] [CrossRef] [Google Scholar]
- Carilli, C. L., Riechers, D., Walter, F., et al. 2013, ApJ, 763, 120 [NASA ADS] [CrossRef] [Google Scholar]
- Carniani, S., Marconi, A., Biggs, A., et al. 2013, A&A, 559, A29 [NASA ADS] [CrossRef] [EDP Sciences] [Google Scholar]
- Cicone, C., Maiolino, R., Gallerani, S., et al. 2015, A&A, 574, A14 [NASA ADS] [CrossRef] [EDP Sciences] [Google Scholar]
- Crenshaw, D. M., & Kraemer, S. B. 2012, ApJ, 753, 75 [NASA ADS] [CrossRef] [Google Scholar]
- Cunha, K., Smith, V. V., & Gibson, B. K. 2008, ApJ, 679, L17 [NASA ADS] [CrossRef] [Google Scholar]
- Dubois, Y., Peirani, S., Pichon, C., et al. 2016, MNRAS, 463, 3948 [NASA ADS] [CrossRef] [Google Scholar]
- Emonts, B. H. C., De Breuck, C., Lehnert, M. D., et al. 2015, A&A, 584, A99 [NASA ADS] [CrossRef] [EDP Sciences] [Google Scholar]
- Flower, D. R., & Pineau des Forêts, G. 2010, MNRAS, 406, 1745 [Google Scholar]
- Fluetsch, A., Maiolino, R., Carniani, S., et al. 2019, MNRAS, 483, 4586 [NASA ADS] [Google Scholar]
- Gerin, M., Neufeld, D. A., & Goicoechea, J. R. 2016, ARA&A, 54, 181 [NASA ADS] [CrossRef] [Google Scholar]
- Godard, B., & Cernicharo, J. 2013, A&A, 550, A8 [NASA ADS] [CrossRef] [EDP Sciences] [Google Scholar]
- Godard, B., Falgarone, E., & Pineau des Forêts, G. 2014, A&A, 570, A27 [NASA ADS] [CrossRef] [EDP Sciences] [Google Scholar]
- González-Alfonso, E., Fischer, J., Isaak, K., et al. 2010, A&A, 518, L43 [NASA ADS] [CrossRef] [EDP Sciences] [Google Scholar]
- González-Alfonso, E., Fischer, J., Graciá-Carpio, J., et al. 2012, A&A, 541, A4 [NASA ADS] [CrossRef] [EDP Sciences] [Google Scholar]
- González-Alfonso, E., Fischer, J., Aalto, S., & Falstad, N. 2014, A&A, 567, A91 [NASA ADS] [CrossRef] [EDP Sciences] [Google Scholar]
- Gray, W. J., & Scannapieco, E. 2017, ApJ, 849, 132 [NASA ADS] [CrossRef] [Google Scholar]
- Guillard, P., Boulanger, F., Lehnert, M. D., et al. 2015, A&A, 574, A32 [NASA ADS] [CrossRef] [EDP Sciences] [Google Scholar]
- Habart, E., Dartois, E., Abergel, A., et al. 2010, A&A, 518, L116 [NASA ADS] [CrossRef] [EDP Sciences] [Google Scholar]
- Habouzit, M., Volonteri, M., & Dubois, Y. 2017, MNRAS, 468, 3935 [NASA ADS] [CrossRef] [Google Scholar]
- Heckman, T. M., Armus, L., & Miley, G. K. 1990, ApJS, 74, 833 [NASA ADS] [CrossRef] [Google Scholar]
- Heckman, T. M., Lehnert, M. D., Strickland, D. K., & Armus, L. 2000, ApJS, 129, 493 [NASA ADS] [CrossRef] [MathSciNet] [Google Scholar]
- Hogerheijde, M. R., Jansen, D. J., & van Dishoeck, E. F. 1995, A&A, 294, 792 [NASA ADS] [Google Scholar]
- Hu, E. M., McMahon, R. G., & Egami, E. 1996, ApJ, 459, L53 [NASA ADS] [CrossRef] [Google Scholar]
- Jones, G. C., Carilli, C. L., Momjian, E., et al. 2016, ApJ, 830, 63 [CrossRef] [Google Scholar]
- Kamenetzky, J., Glenn, J., Rangwala, N., et al. 2012, ApJ, 753, 70 [NASA ADS] [CrossRef] [Google Scholar]
- Kavak, Ü., van der Tak, F. F. S., Tielens, A. G. G. M., & Shipman, R. F. 2019, A&A, 631, A117 [CrossRef] [EDP Sciences] [Google Scholar]
- Lehnert, M. D., & Heckman, T. M. 1996, ApJ, 472, 546 [NASA ADS] [CrossRef] [Google Scholar]
- Lehnert, M. D., van Driel, W., Le Tiran, L., Di Matteo, P., & Haywood, M. 2015, A&A, 577, A112 [NASA ADS] [CrossRef] [EDP Sciences] [Google Scholar]
- Leitherer, C., Schaerer, D., Goldader, J. D., et al. 1999, ApJS, 123, 3 [Google Scholar]
- Lis, D. C., Neufeld, D. A., Phillips, T. G., Gerin, M., & Neri, R. 2011, ApJ, 738, L6 [NASA ADS] [CrossRef] [Google Scholar]
- Liu, L., Weiß, A., Perez-Beaupuits, J. P., et al. 2017, ApJ, 846, 5 [NASA ADS] [CrossRef] [Google Scholar]
- Lu, N., Zhao, Y., Díaz-Santos, T., et al. 2017a, ApJ, 842, L16 [NASA ADS] [CrossRef] [Google Scholar]
- Lu, N., Zhao, Y., Díaz-Santos, T., et al. 2017b, ApJS, 230, 1 [NASA ADS] [CrossRef] [Google Scholar]
- Lu, N., Cao, T., Díaz-Santos, T., et al. 2018, ApJ, 864, 38 [CrossRef] [Google Scholar]
- Lugaro, M., de Mink, S. E., Izzard, R. G., et al. 2008, A&A, 484, L27 [NASA ADS] [CrossRef] [EDP Sciences] [Google Scholar]
- McMahon, R. G., Omont, A., Bergeron, J., Kreysa, E., & Haslam, C. G. T. 1994, MNRAS, 267, L9 [NASA ADS] [CrossRef] [Google Scholar]
- McMullin, J. P., Waters, B., Schiebel, D., Young, W., & Golap, K. 2007, in ADASS XVI, eds. R. A. Shaw, F. Hill, & D. J. Bell, ASP Conf. Ser., 376, 127 [Google Scholar]
- Meijerink, R., & Spaans, M. 2005, A&A, 436, 397 [NASA ADS] [CrossRef] [EDP Sciences] [Google Scholar]
- Meijerink, R., Spaans, M., Loenen, A. F., & van der Werf, P. P. 2011, A&A, 525, A119 [NASA ADS] [CrossRef] [EDP Sciences] [Google Scholar]
- Meijerink, R., Cazaux, S., & Spaans, M. 2012, A&A, 537, A102 [NASA ADS] [CrossRef] [EDP Sciences] [Google Scholar]
- Monje, R. R., Emprechtinger, M., Phillips, T. G., et al. 2011a, ApJ, 734, L23 [NASA ADS] [CrossRef] [Google Scholar]
- Monje, R. R., Phillips, T. G., Peng, R., et al. 2011b, ApJ, 742, L21 [NASA ADS] [CrossRef] [Google Scholar]
- Monje, R. R., Lord, S., Falgarone, E., et al. 2014, ApJ, 785, 22 [NASA ADS] [CrossRef] [Google Scholar]
- Nagy, Z., Choi, Y., Ossenkopf-Okada, V., et al. 2017, A&A, 599, A22 [NASA ADS] [CrossRef] [EDP Sciences] [Google Scholar]
- Neufeld, D. A., & Wolfire, M. G. 2009, ApJ, 706, 1594 [NASA ADS] [CrossRef] [Google Scholar]
- Neufeld, D. A., Zmuidzinas, J., Schilke, P., & Phillips, T. G. 1997, ApJ, 488, L141 [NASA ADS] [CrossRef] [Google Scholar]
- Neufeld, D. A., Wolfire, M. G., & Schilke, P. 2005, ApJ, 628, 260 [NASA ADS] [CrossRef] [Google Scholar]
- Neufeld, D. A., Sonnentrucker, P., Phillips, T. G., et al. 2010, A&A, 518, L108 [NASA ADS] [CrossRef] [EDP Sciences] [Google Scholar]
- O’Dell, C. R., Kollatschny, W., & Ferland, G. J. 2017, ApJ, 837, 151 [NASA ADS] [CrossRef] [Google Scholar]
- Ohta, K., Yamada, T., Nakanishi, K., et al. 1996, Nature, 382, 426 [NASA ADS] [CrossRef] [Google Scholar]
- Omont, A., Petitjean, P., Guilloteau, S., et al. 1996, Nature, 382, 428 [NASA ADS] [CrossRef] [PubMed] [Google Scholar]
- Omont, A., Yang, C., Cox, P., et al. 2013, A&A, 551, A115 [NASA ADS] [CrossRef] [EDP Sciences] [Google Scholar]
- Pereira-Santaella, M., Spinoglio, L., Busquet, G., et al. 2013, ApJ, 768, 55 [NASA ADS] [CrossRef] [Google Scholar]
- Pérez-Beaupuits, J. P., Güsten, R., Harris, A., et al. 2018, ApJ, 860, 23 [CrossRef] [Google Scholar]
- Prantzos, N., Abia, C., Limongi, M., Chieffi, A., & Cristallo, S. 2018, MNRAS, 476, 3432 [NASA ADS] [CrossRef] [Google Scholar]
- Rangwala, N., Maloney, P. R., Glenn, J., et al. 2011, ApJ, 743, 94 [NASA ADS] [CrossRef] [Google Scholar]
- Renda, A., Fenner, Y., Gibson, B. K., et al. 2004, MNRAS, 354, 575 [NASA ADS] [CrossRef] [Google Scholar]
- Salgado, F., Berné, O., Adams, J. D., et al. 2016, ApJ, 830, 118 [NASA ADS] [CrossRef] [Google Scholar]
- Salomé, P., Guélin, M., Downes, D., et al. 2012, A&A, 545, A57 [NASA ADS] [CrossRef] [EDP Sciences] [Google Scholar]
- Scannapieco, E., & Oh, S. P. 2004, ApJ, 608, 62 [NASA ADS] [CrossRef] [Google Scholar]
- Smail, I., Ivison, R. J., & Blain, A. W. 1997, ApJ, 490, L5 [NASA ADS] [CrossRef] [Google Scholar]
- Sonnentrucker, P., Wolfire, M., Neufeld, D. A., et al. 2015, ApJ, 806, 49 [NASA ADS] [CrossRef] [Google Scholar]
- Tombesi, F., Meléndez, M., Veilleux, S., et al. 2015, Nature, 519, 436 [Google Scholar]
- van der Werf, P. P., Isaak, K. G., Meijerink, R., et al. 2010, A&A, 518, L42 [NASA ADS] [CrossRef] [EDP Sciences] [Google Scholar]
- van der Tak, F. F. S. 2012, Philos. Trans. R. Soc. London Ser. A, 370, 5186 [Google Scholar]
- van der Tak, F. F. S., Ossenkopf, V., Nagy, Z., et al. 2012, A&A, 537, L10 [NASA ADS] [CrossRef] [EDP Sciences] [Google Scholar]
- van der Tak, F. F. S., Black, J. H., Schöier, F. L., Jansen, D. J., & van Dishoeck, E. F. 2007, A&A, 468, 627 [NASA ADS] [CrossRef] [EDP Sciences] [Google Scholar]
- van der Wiel, M. H. D., Naylor, D. A., Makiwa, G., Satta, M., & Abergel, A. 2016, A&A, 593, A37 [NASA ADS] [CrossRef] [EDP Sciences] [Google Scholar]
- Wagg, J., Carilli, C. L., Aravena, M., et al. 2014, ApJ, 783, 71 [CrossRef] [Google Scholar]
- Walker, G. A. H. 2012, New A Rev., 56, 9 [CrossRef] [Google Scholar]
- Yang, C., Gao, Y., Omont, A., et al. 2013, ApJ, 771, L24 [NASA ADS] [CrossRef] [Google Scholar]
- Yang, C., Omont, A., Beelen, A., et al. 2016, A&A, 595, A80 [NASA ADS] [CrossRef] [EDP Sciences] [Google Scholar]
All Tables
Characteristics of the dust continuum and the H2O and HF emission lines in BR 1202-0725.
All Figures
|
Fig. 1. Left: total intensity image of the 1.2 THz rest-frame continuum of both the QSO and SMG, along with Lyα emitter 2 in BR 1202-0725 The half power beam size of the data, 0 |
| In the text | |
|
Fig. 2. Continuum-subtracted spectra of HF J = 1–0 and H2O (220–211) in BR 1202-0725. The black line are the data after being Hanning smoothed to a velocity resolution of 11 km s−1. The red line shows the data binned into six channels and subsequently Hanning smoothed to a velocity resolution of 66 km s−1. Top: spectrum of H2O emission from the SMG. Indicated with the magenta dashed line is the velocity of the expected HF J = 1–0 feature, which may (at best) be tentatively detected, relative to the velocity of H2O. Bottom: spectrum of HF J = 1–0 and H2O (220–211) emission from the QSO. The zero-velocity of the QSO is derived from a Gaussian fit to the H2O profile of the QSO, resulting in z = 4.6948 ± 0.0001. The redshift of the SMG is assumed to be z = 4.6915 from Carilli et al. (2013). The Gaussian functions represented with a solid line are fits to the HF (magenta) and H2O (blue) emission, as summarized in Table 1. The Gaussian represented with the dotted brown line for the SMG is the fit to the [CII] line (Carilli et al. 2013). The horizontal axis on the bottom (top) gives the corresponding velocity centered on the HF (H2O) line, as indicated with the magenta (blue) dashed line. The light gray region indicates the gap in the spectra between the two spectral windows. |
| In the text | |
|
Fig. 3. Relationship between the infrared luminosity and the ratio of the HF luminosity and infrared luminosity of BR 1202-0725, a sample of local AGN (Yang et al. 2013), and the Orion Bar (Salgado et al. 2016; Nagy et al. 2017). All sources are labeled. We show a least-squares fit to the local AGN, QSO, and the Orion Bar (black line with the dotted line extension to the Orion Bar), which implies the ratio is constant. We note that fitting the AGN and QSO only yields a similar fit but with a slightly steeper slope. For comparison, we show the ratio LHF/LIR for the entire IR luminosity of the Orion Bar and the luminosity if only 2% of the total IR luminosity is within the Herschel beam used to measure the HF flux (see text for details). |
| In the text | |
|
Fig. 4. Relationship between the infrared luminosity, LIR, and the ratio of the LH2O (220 − 211) and LIR of BR 1202-0725 (red hexagons) and for a sample of local galaxies (blue hollow squares Yang et al. 2013). We show a least-squares fit to all galaxies (blue line, slope of 0.19 ± 0.02). To make the estimates for the QSO and SMG, we used the infrared luminosities from Salomé et al. (2012). Other estimates from the literature are a few times higher (Wagg et al. 2014; Lu et al. 2018) and would yield values that have greater consistency with the best fit shown in the figure. |
| In the text | |
Current usage metrics show cumulative count of Article Views (full-text article views including HTML views, PDF and ePub downloads, according to the available data) and Abstracts Views on Vision4Press platform.
Data correspond to usage on the plateform after 2015. The current usage metrics is available 48-96 hours after online publication and is updated daily on week days.
Initial download of the metrics may take a while.