Fig. 2.
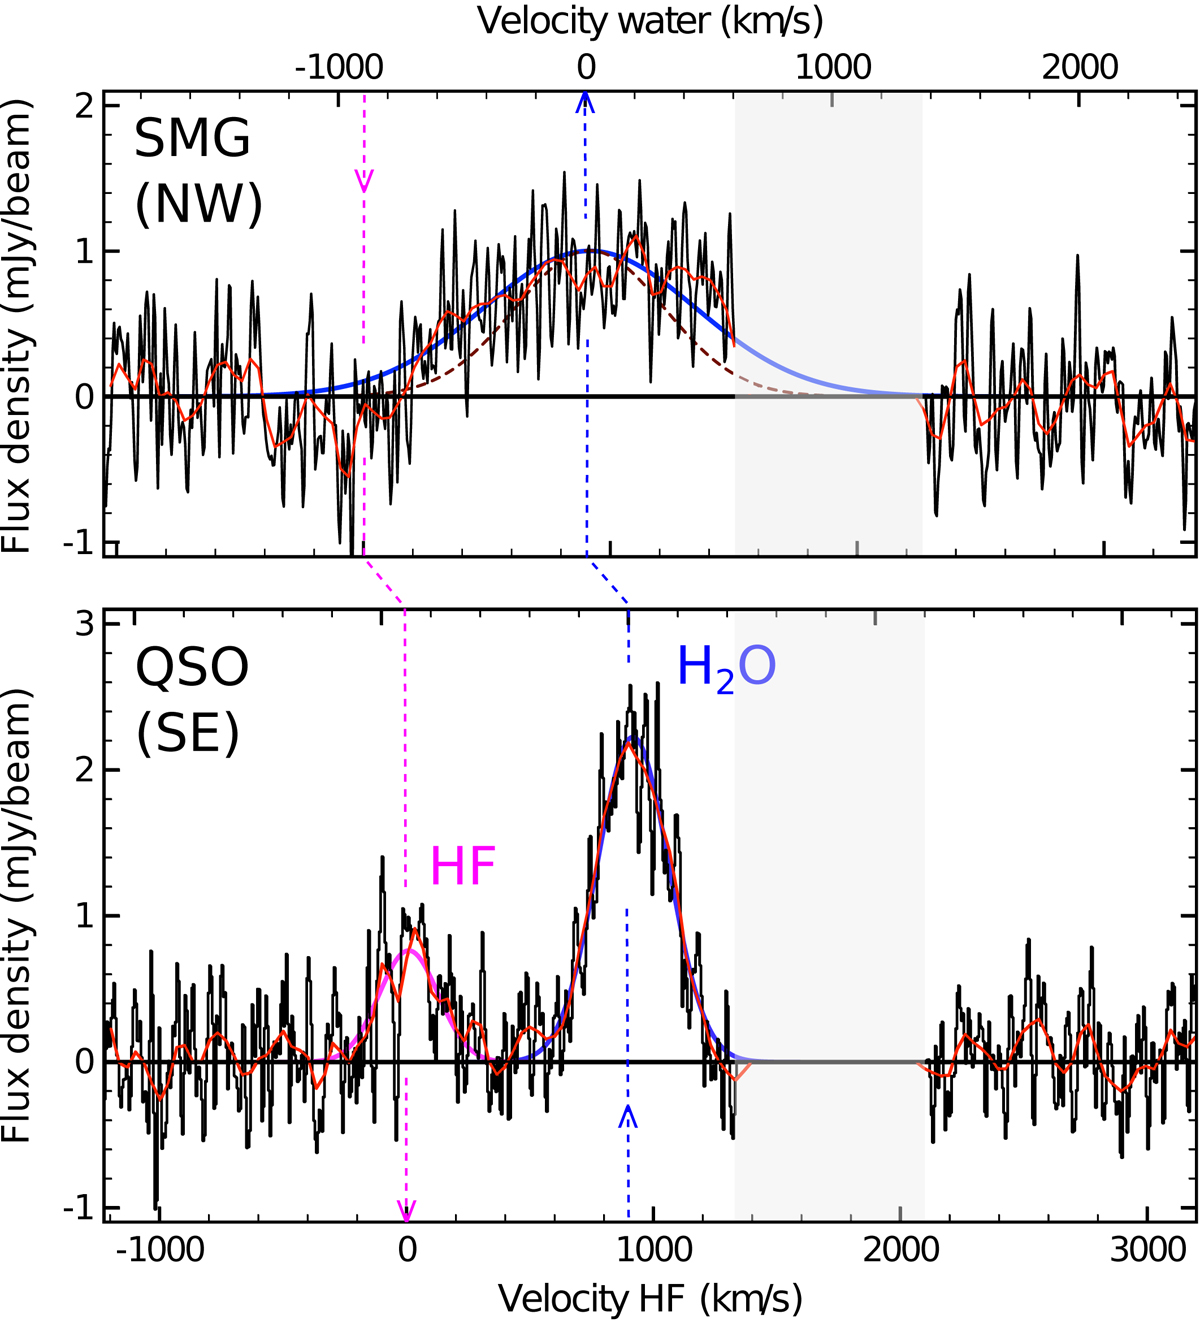
Continuum-subtracted spectra of HF J = 1–0 and H2O (220–211) in BR 1202-0725. The black line are the data after being Hanning smoothed to a velocity resolution of 11 km s−1. The red line shows the data binned into six channels and subsequently Hanning smoothed to a velocity resolution of 66 km s−1. Top: spectrum of H2O emission from the SMG. Indicated with the magenta dashed line is the velocity of the expected HF J = 1–0 feature, which may (at best) be tentatively detected, relative to the velocity of H2O. Bottom: spectrum of HF J = 1–0 and H2O (220–211) emission from the QSO. The zero-velocity of the QSO is derived from a Gaussian fit to the H2O profile of the QSO, resulting in z = 4.6948 ± 0.0001. The redshift of the SMG is assumed to be z = 4.6915 from Carilli et al. (2013). The Gaussian functions represented with a solid line are fits to the HF (magenta) and H2O (blue) emission, as summarized in Table 1. The Gaussian represented with the dotted brown line for the SMG is the fit to the [CII] line (Carilli et al. 2013). The horizontal axis on the bottom (top) gives the corresponding velocity centered on the HF (H2O) line, as indicated with the magenta (blue) dashed line. The light gray region indicates the gap in the spectra between the two spectral windows.
Current usage metrics show cumulative count of Article Views (full-text article views including HTML views, PDF and ePub downloads, according to the available data) and Abstracts Views on Vision4Press platform.
Data correspond to usage on the plateform after 2015. The current usage metrics is available 48-96 hours after online publication and is updated daily on week days.
Initial download of the metrics may take a while.