Fig. 4.
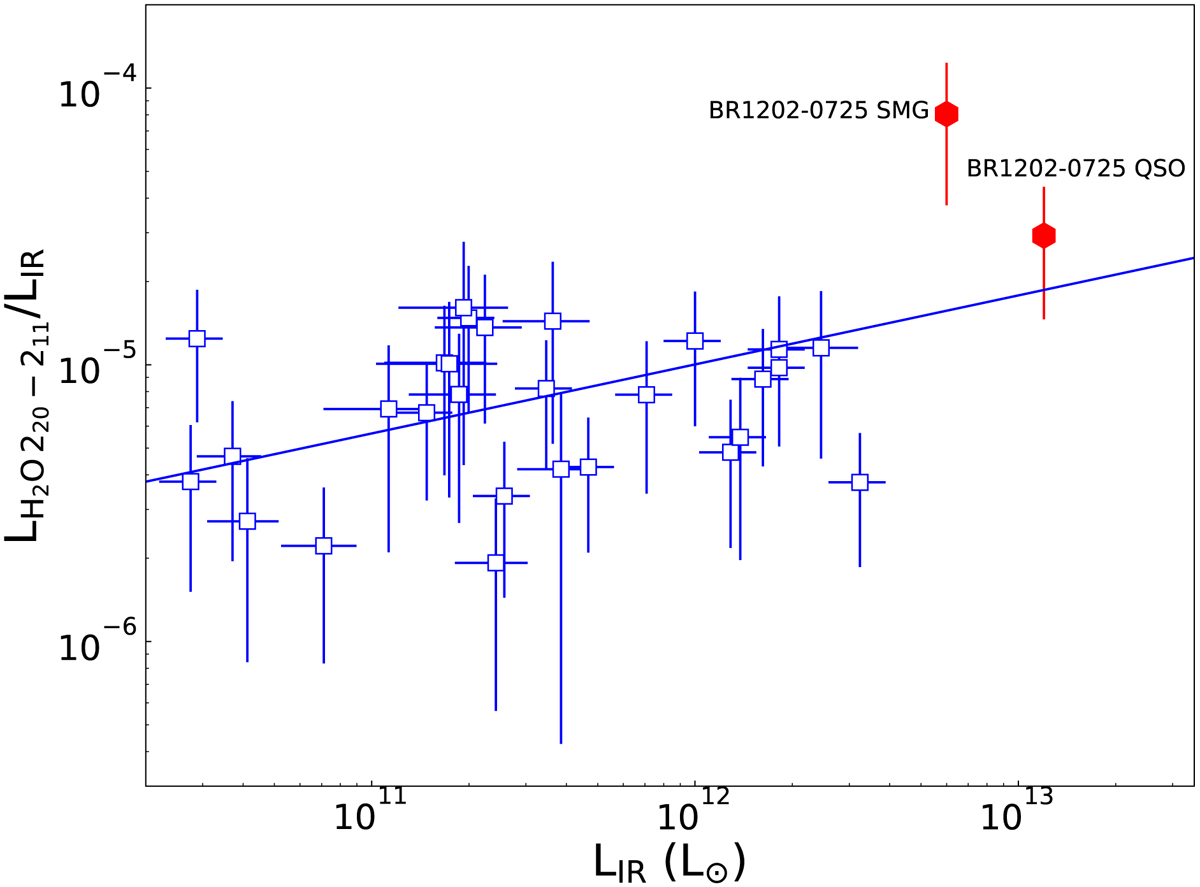
Relationship between the infrared luminosity, LIR, and the ratio of the LH2O (220 − 211) and LIR of BR 1202-0725 (red hexagons) and for a sample of local galaxies (blue hollow squares Yang et al. 2013). We show a least-squares fit to all galaxies (blue line, slope of 0.19 ± 0.02). To make the estimates for the QSO and SMG, we used the infrared luminosities from Salomé et al. (2012). Other estimates from the literature are a few times higher (Wagg et al. 2014; Lu et al. 2018) and would yield values that have greater consistency with the best fit shown in the figure.
Current usage metrics show cumulative count of Article Views (full-text article views including HTML views, PDF and ePub downloads, according to the available data) and Abstracts Views on Vision4Press platform.
Data correspond to usage on the plateform after 2015. The current usage metrics is available 48-96 hours after online publication and is updated daily on week days.
Initial download of the metrics may take a while.