Fig. 7.
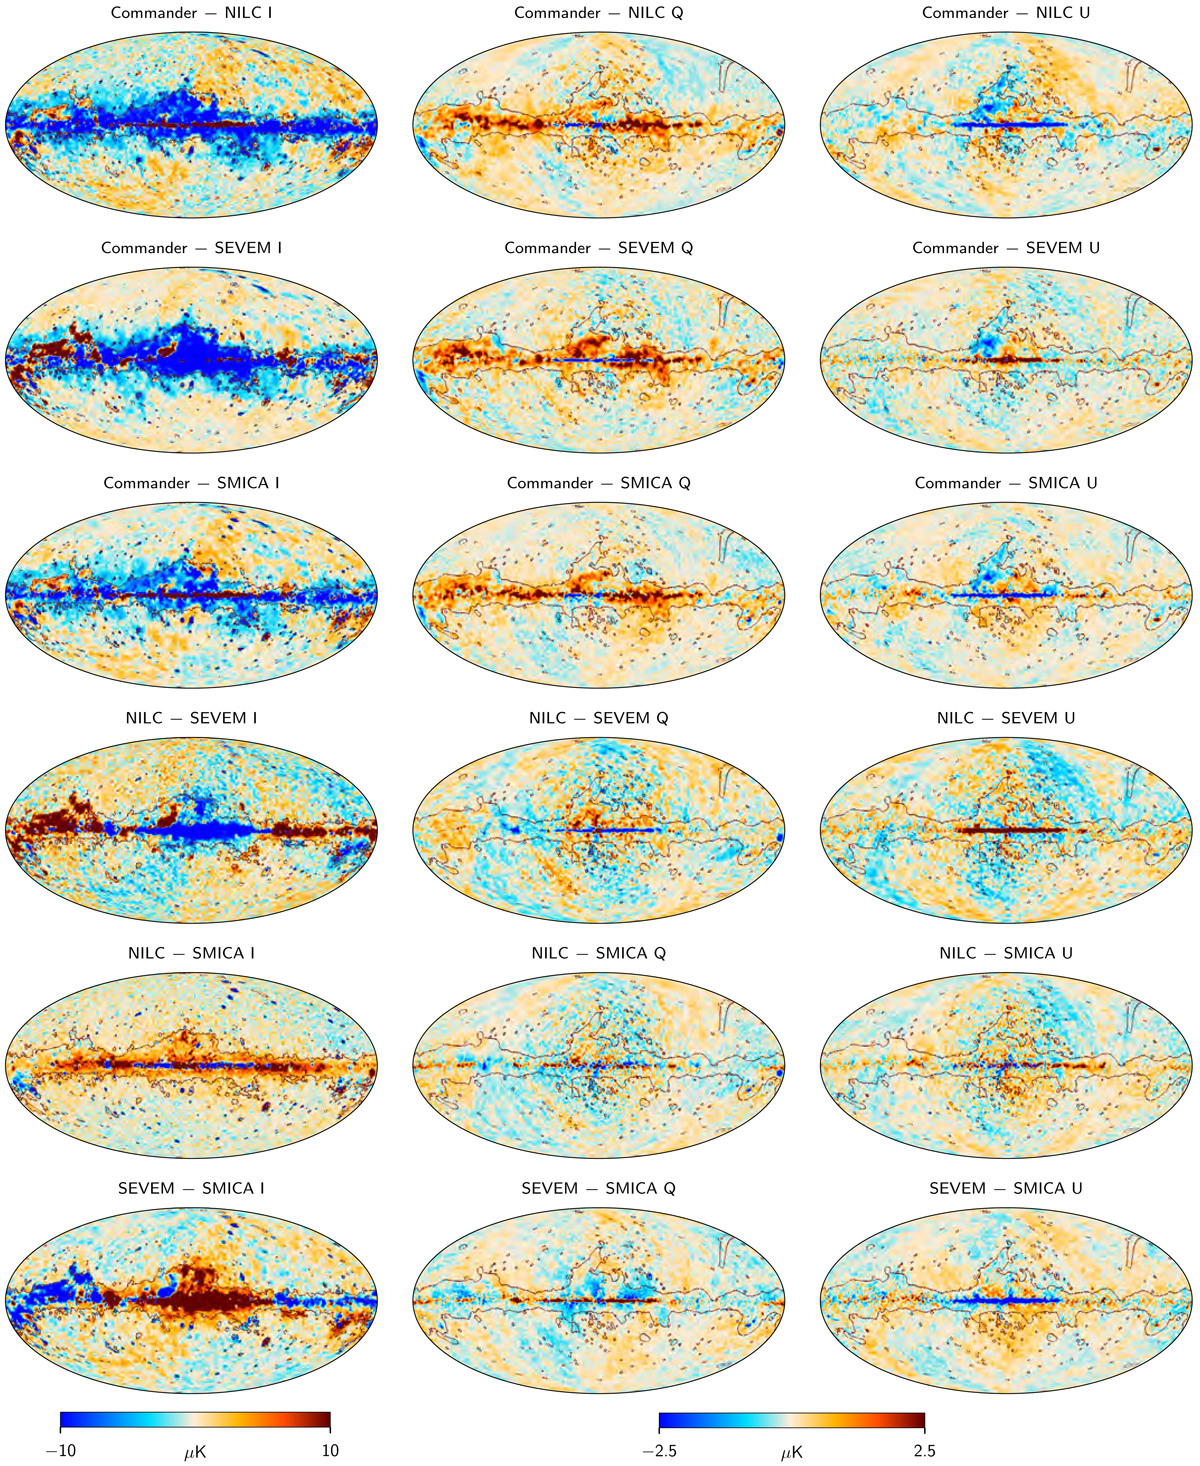
Pairwise differences between maps from the four CMB component separation pipelines, smoothed to 80′ resolution. Columns show Stokes I, Q, and U, respectively, while rows show results for different pipeline combinations. The lines show the regions masked in component separation. Monopoles and dipoles have been subtracted with parameters fitted outside a |b| < 30° mask.
Current usage metrics show cumulative count of Article Views (full-text article views including HTML views, PDF and ePub downloads, according to the available data) and Abstracts Views on Vision4Press platform.
Data correspond to usage on the plateform after 2015. The current usage metrics is available 48-96 hours after online publication and is updated daily on week days.
Initial download of the metrics may take a while.