Fig. H.2.
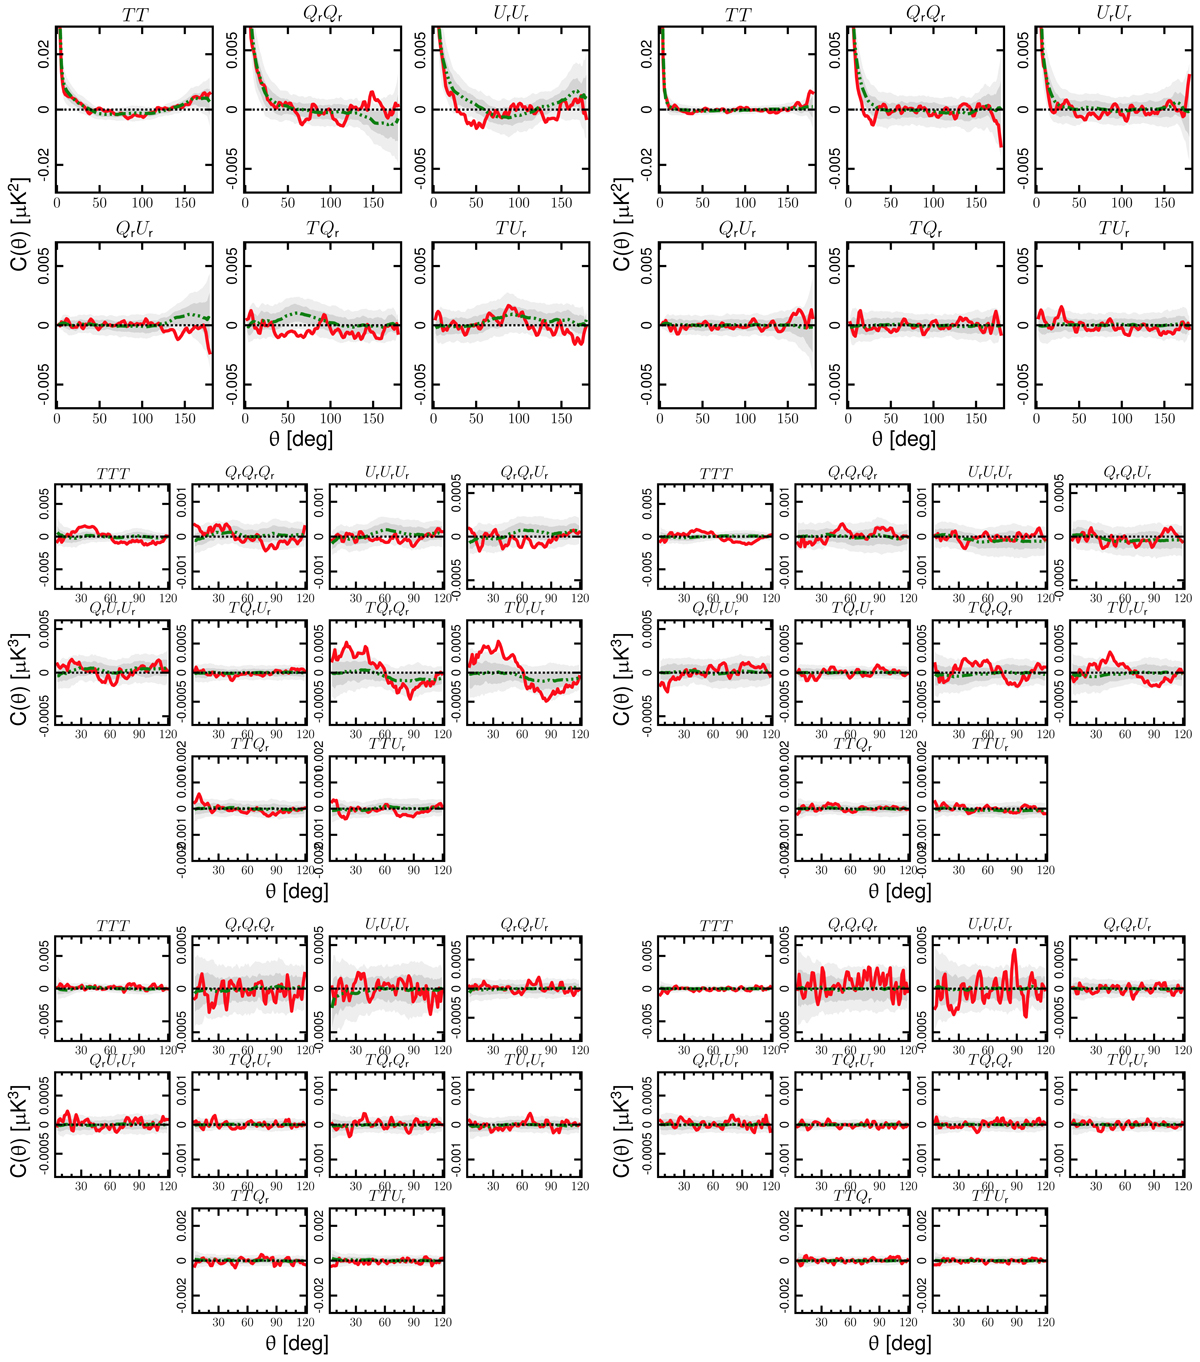
2-point (upper panels), pseudo-collapsed (middle panels), and equilateral (lower panels) 3-point correlation functions determined from the Nside = 64 Planck SEVEM HMHD (left panels) and OEHD (right panels) temperature and polarization map. The red solid line corresponds to the half-difference maps (HMHD or OEHD). The green triple-dot-dashed line indicates the mean determined from 300 FFP10 noise simulations. The shaded dark and light grey regions indicate the corresponding 68% and 95% confidence regions, respectively.
Current usage metrics show cumulative count of Article Views (full-text article views including HTML views, PDF and ePub downloads, according to the available data) and Abstracts Views on Vision4Press platform.
Data correspond to usage on the plateform after 2015. The current usage metrics is available 48-96 hours after online publication and is updated daily on week days.
Initial download of the metrics may take a while.