Fig. F.1.
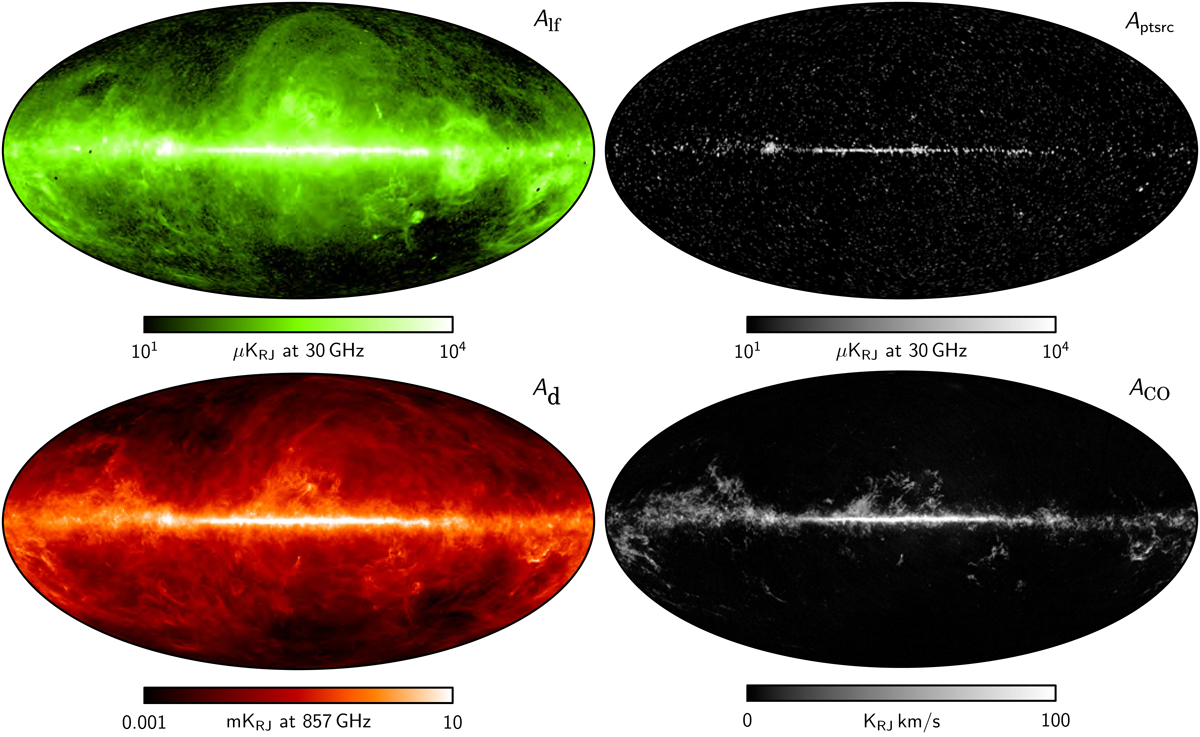
Commander foreground amplitude maps, derived from the Planck 2018 data set in intensity. Top-left panel: combined low-frequency foreground map at 40′ FWHM resolution, evaluated at 30 GHz, and accounts for synchrotron, free-free, and anomalous microwave emission. Top-right panel: derived radio point source map, as observed in the 30 GHz frequency channel. Bottom-left panel: thermal dust emission at 10′ FWHM resolution, evaluated at 857 GHz. Neither the CIB nor high-frequency point sources are fitted explicitly in the Commander 2018 temperature model, and these are therefore in effect included in this thermal dust emission map. Bottom-right panel: CO line-emission map, evaluated for the 100 GHz channel.
Current usage metrics show cumulative count of Article Views (full-text article views including HTML views, PDF and ePub downloads, according to the available data) and Abstracts Views on Vision4Press platform.
Data correspond to usage on the plateform after 2015. The current usage metrics is available 48-96 hours after online publication and is updated daily on week days.
Initial download of the metrics may take a while.