Fig. C.1.
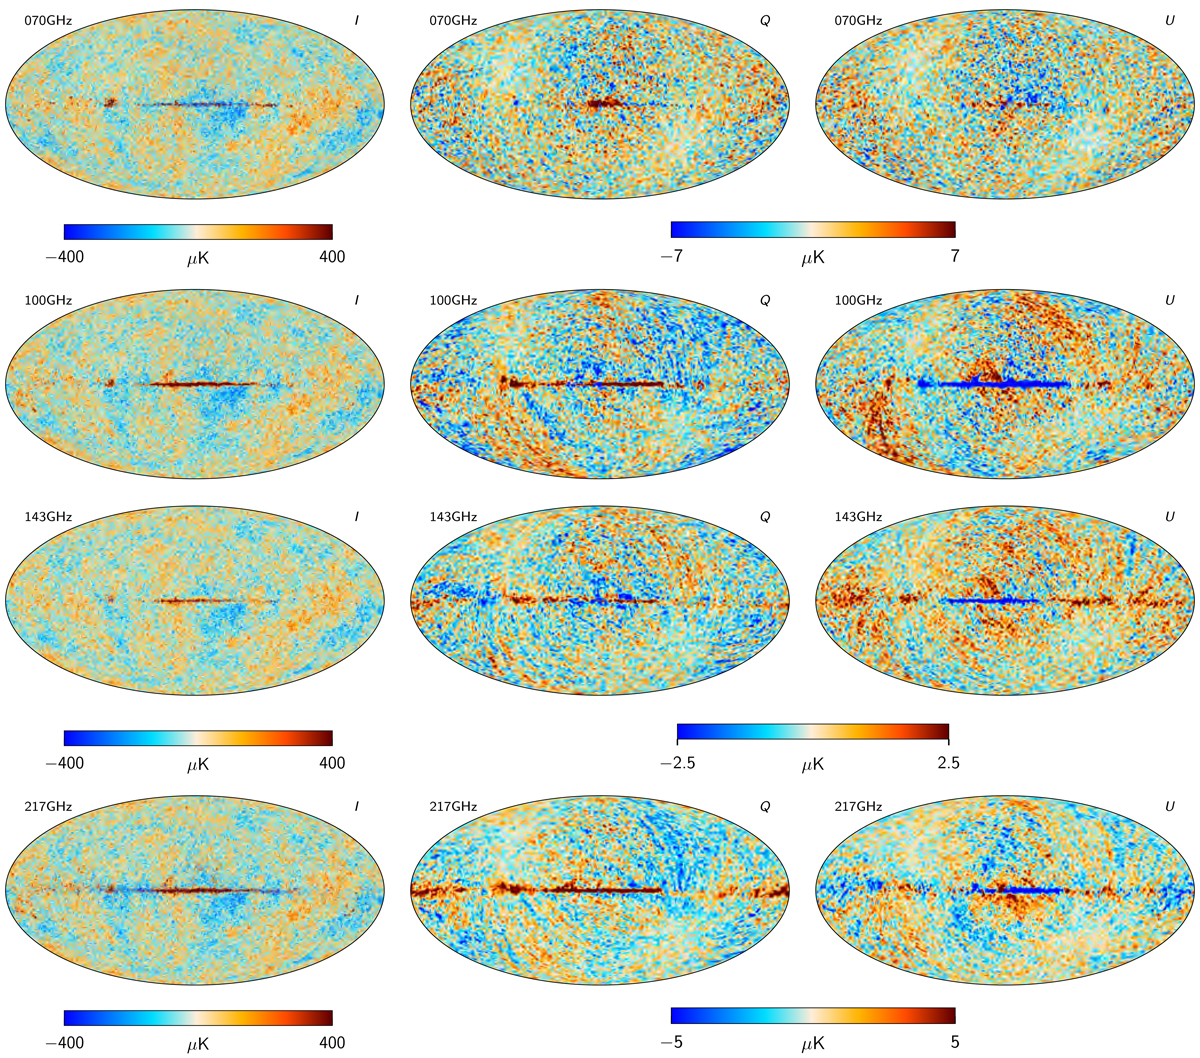
Cleaned single-frequency CMB maps from the SEVEM pipeline. The cleaned maps in intensity (left column) are given at their original resolution, while the polarization maps (Q and U, middle and right columns) have been smoothed with a Gaussian beam of 80′ FWHM resolution for better visualization. Rows show results for different frequencies (70, 100, 143, and 217 GHz).
Current usage metrics show cumulative count of Article Views (full-text article views including HTML views, PDF and ePub downloads, according to the available data) and Abstracts Views on Vision4Press platform.
Data correspond to usage on the plateform after 2015. The current usage metrics is available 48-96 hours after online publication and is updated daily on week days.
Initial download of the metrics may take a while.