Free Access
Fig. B.1.
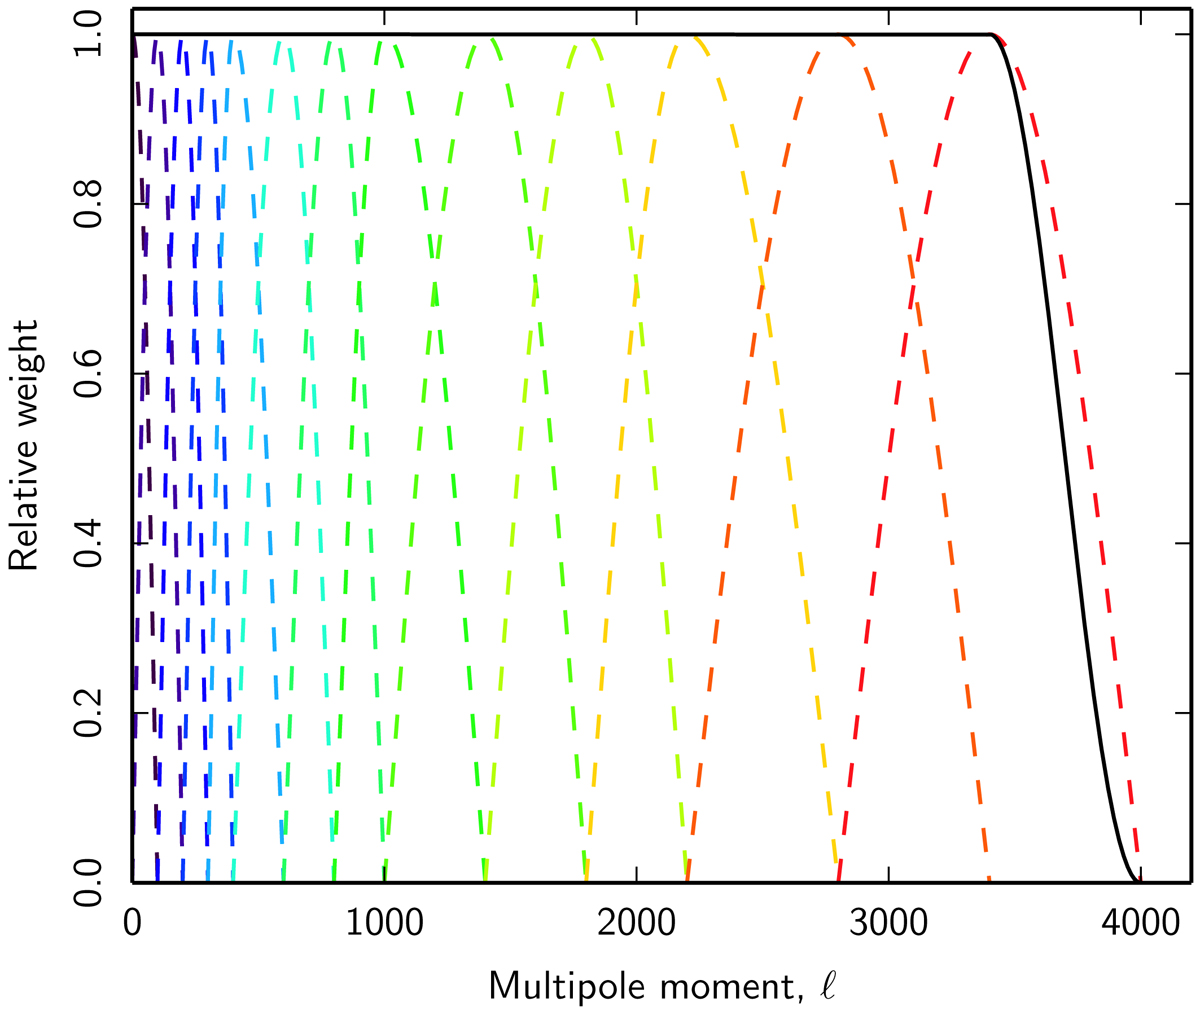
Needlet bands used in the analysis. The solid black line shows the normalization of the needlet bands, i.e., the total filter applied to the original map after needlet decomposition and synthesis of the output map from needlet coefficients.
Current usage metrics show cumulative count of Article Views (full-text article views including HTML views, PDF and ePub downloads, according to the available data) and Abstracts Views on Vision4Press platform.
Data correspond to usage on the plateform after 2015. The current usage metrics is available 48-96 hours after online publication and is updated daily on week days.
Initial download of the metrics may take a while.