Fig. 35.
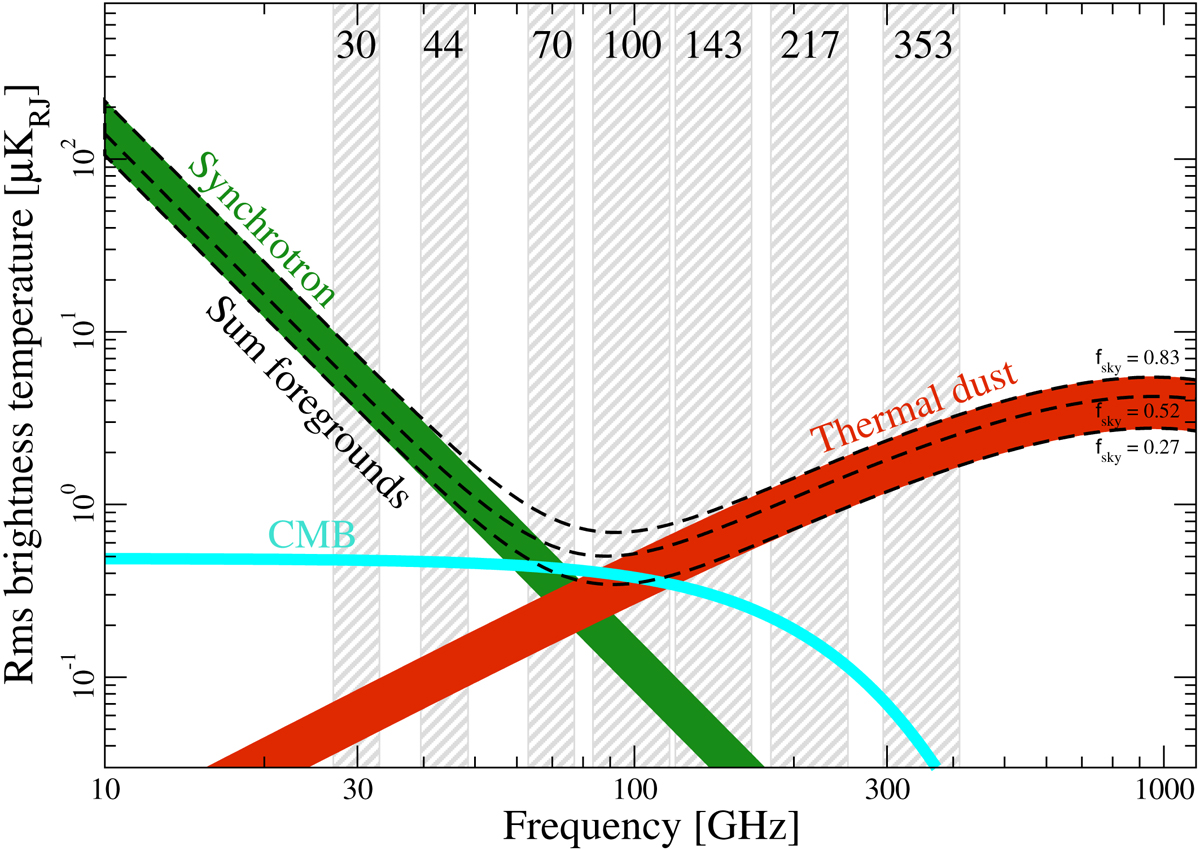
Polarization amplitude rms as a function of frequency and astrophysical components, evaluated at a smoothing scale of 40′ FWHM. The green band indicates polarized synchrotron emission, and the red band indicates polarized thermal dust emission. The cyan curve shows the CMB rms for a ΛCDM model with τ = 0.05, and is strongly dominated by E-mode polarization. The dashed black lines indicate the sum of foregrounds evaluated over three different masks with fsky = 0.83, 0.52, and 0.27. The widths of the synchrotron and thermal dust bands are defined by the largest and smallest sky coverages.
Current usage metrics show cumulative count of Article Views (full-text article views including HTML views, PDF and ePub downloads, according to the available data) and Abstracts Views on Vision4Press platform.
Data correspond to usage on the plateform after 2015. The current usage metrics is available 48-96 hours after online publication and is updated daily on week days.
Initial download of the metrics may take a while.