Fig. 29.
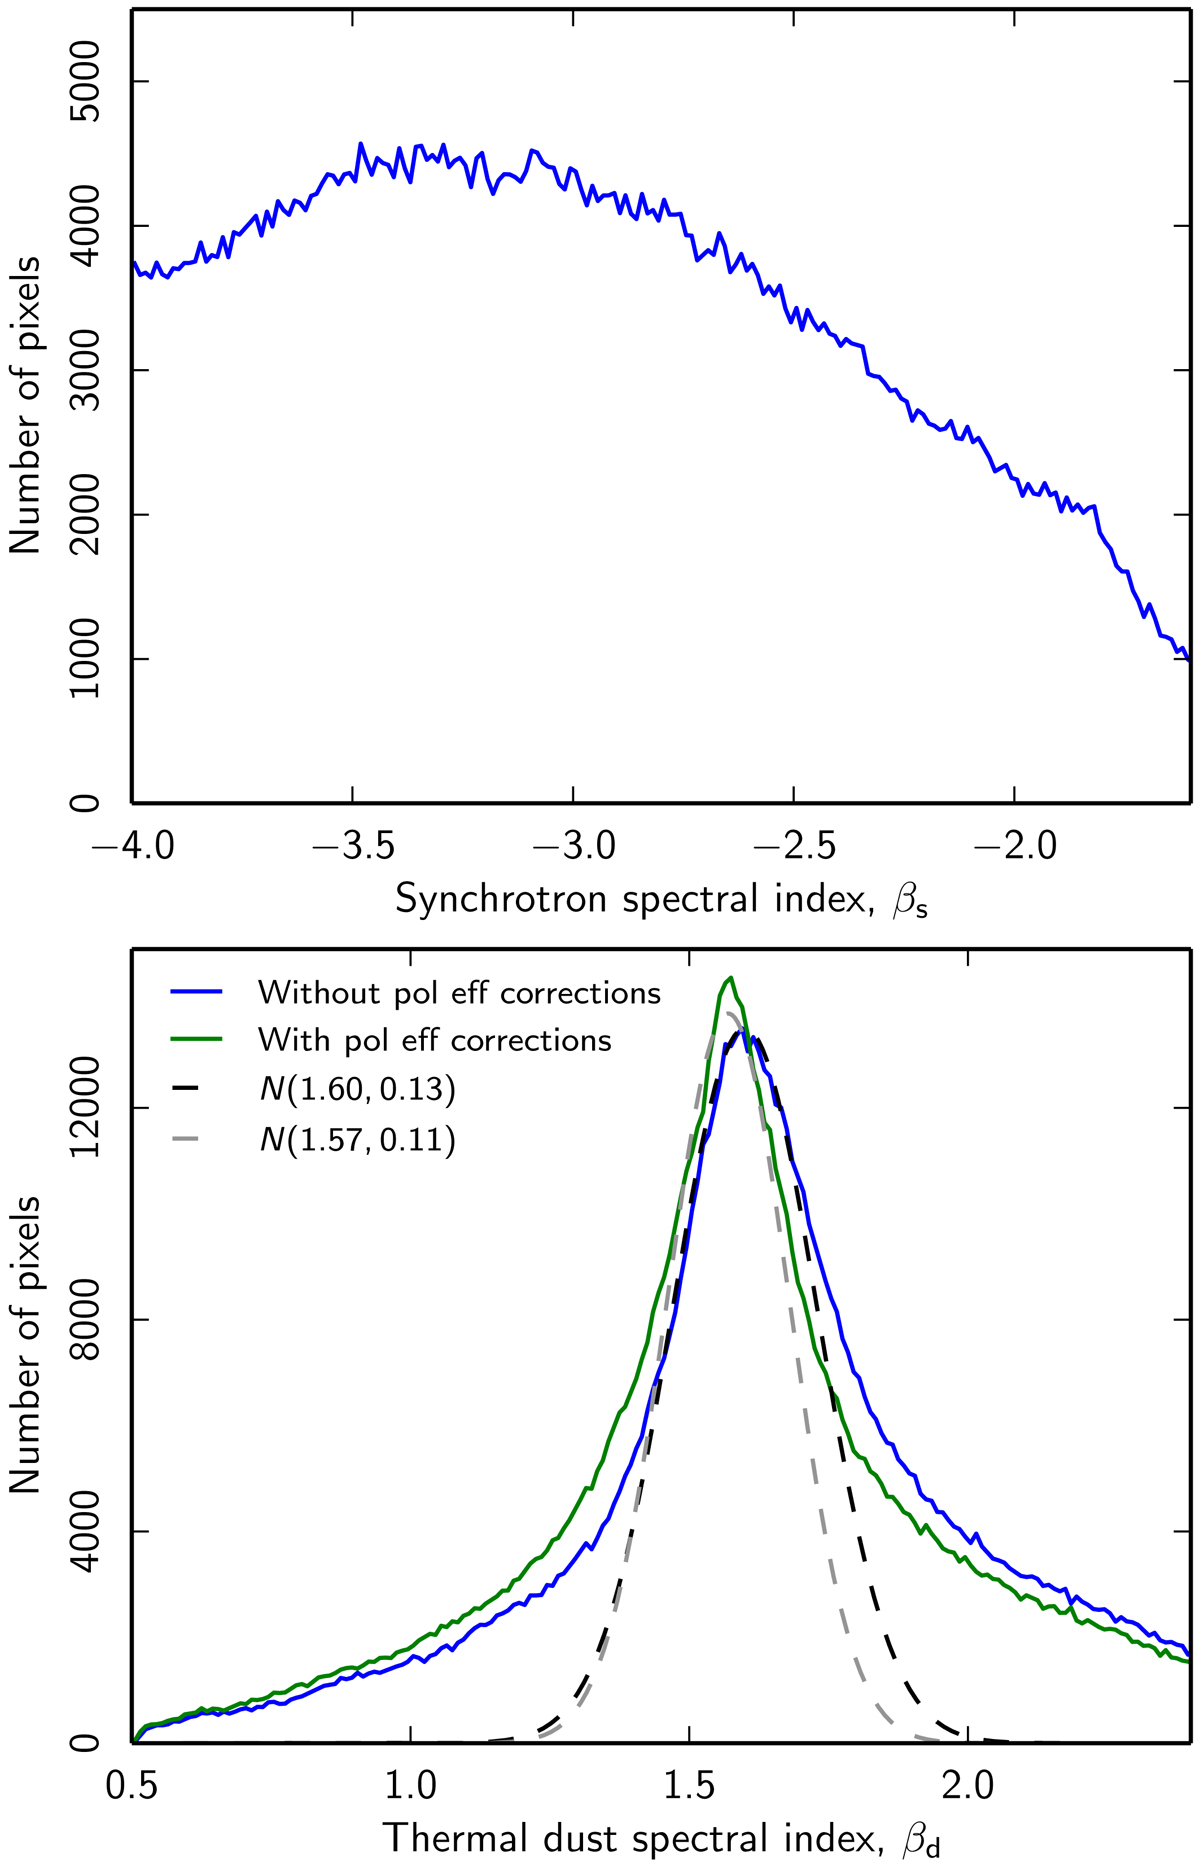
Distribution of spectral indices for polarized synchrotron (top panel) and thermal dust (bottom panel) emission as estimated with Commander without applying any informative Gaussian prior. The synchrotron spectral index shown in this plot is estimated with a 5° FWHM smoothing scale, and the thermal dust spectral index is estimated with a 3° FWHM smoothing scale. For the thermal dust case, results are shown both with (green curve) and without (blue curve) applying polarization efficiency corrections at 100–217 GHz. The dashed lines in this case indicate Gaussian fits to the central peak.
Current usage metrics show cumulative count of Article Views (full-text article views including HTML views, PDF and ePub downloads, according to the available data) and Abstracts Views on Vision4Press platform.
Data correspond to usage on the plateform after 2015. The current usage metrics is available 48-96 hours after online publication and is updated daily on week days.
Initial download of the metrics may take a while.