| Issue |
A&A
Volume 640, August 2020
|
|
|---|---|---|
| Article Number | A35 | |
| Number of page(s) | 9 | |
| Section | Stellar structure and evolution | |
| DOI | https://doi.org/10.1051/0004-6361/202038333 | |
| Published online | 07 August 2020 | |
Optical counterpart to Swift J0243.6+6124
1
Institute of Astrophysics, Foundation for Research and Technology-Hellas, 71110 Heraklion, Greece
e-mail: This email address is being protected from spambots. You need JavaScript enabled to view it.
2
Physics Department, University of Crete, 71003 Heraklion, Greece
3
Observatorio Astronómico, Universidad de Valencia, Catedrático José Beltrán 2, 46980 Paterna, Spain
4
Centro de Astrobiología-Departamento de Astrofísica (CSIC-INTA), Camino Bajo del Castillo s/n, 28692 Villanueva de la Cañada, Spain
Received:
4
May
2020
Accepted:
11
June
2020
Abstract
Context. Swift J0243.6+6124 is a unique system. It is the first and only ultra-luminous X-ray source in our Galaxy. It is the first and only high-mass Be X-ray pulsar showing radio jet emission. It was discovered during a giant X-ray outburst in October 2017. While there are numerous studies in the X-ray band, very little is known about the optical counterpart.
Aims. Our aim is to characterize the variability timescales in the optical and infrared bands in order to understand the nature of this intriguing system.
Methods. We performed optical spectroscopic observations to determine the spectral type. Long-term photometric light curves together with the equivalent width of the Hα line were used to monitor the state of the circumstellar disk. We used BVRI photometry to estimate the interstellar absorption and distance to the source. Continuous photometric monitoring in the B and V bands allowed us to search for intra-night variability.
Results. The optical counterpart to Swift J0243.6+6124 is a V = 12.9, O9.5Ve star, located at a distance of ∼5 kpc. The optical extinction in the direction of the source is AV = 3.6 mag. The rotational velocity of the O-type star is 210 km s−1. The long-term optical variability agrees with the growth and subsequent dissipation of the Be circumstellar disk after the giant X-ray outburst. The optical and X-ray luminosity are strongly correlated during the outburst, suggesting a common origin. We did not detect short-term periodic variability that could be associated with nonradial pulsations from the Be star photosphere.
Conclusions. The long-term optical and infrared pattern of variability of Swift J0243.6+6124 is typical of Be/X-ray binaries. However, the absence of nonradial pulsations is unusual and adds another peculiar trait to this unique source.
Key words: stars: emission-line / Be / binaries: close / X-rays: binaries / stars: individual: Swift J0243.6+6124 / stars: neutron
© ESO 2020
1. Introduction
Swift J0243.6+6124 was first detected by the Burst Alert Telescope (BAT) on board the Neil Gehrels Swift observatory on 3 October 2017 during a giant X-ray outburst (Kennea et al. 2017). The timing analysis revealed a periodicity at 9.86 s, suggesting that the new transient is an X-ray pulsar. Pulsations were subsequently confirmed by Fermi (Jenke & Wilson-Hodge 2017) and NuSTAR (Bahramian et al. 2017). The Fermi/GBM accreting pulsar history and Insight-HXMT observations allowed the determination of the orbital ephemeris. The orbital period is 28 days, and the eccentricity 0.1 (Doroshenko et al. 2018; Wilson-Hodge et al. 2018; Zhang et al. 2019).
The X-ray spectrum, characterized by a cutoff power-law continuum (Zhang et al. 2019) and iron line emission (Jaisawal et al. 2019), is typical of high-mass X-ray binaries. The strong magnetic field (> 1012 G), estimated from accretion torque models and changes of the timing and the X-ray spectral parameters during transitions between accretion regimes, confirms the system as a hard X-ray transient (Doroshenko et al. 2018, 2020; Tsygankov et al. 2018). A tentative cyclotron line at ∼10 keV was reported by Sugizaki et al. (2020), which would place the magnetic field of Swift J0243.6+6124 in line with that of standard accreting pulsars. One or more blackbody components associated with the hot spot around the polar region and thermal emission from the accretion column and from the photosphere of a possible ultra-fast outflow (Tao et al. 2019; van den Eijnden et al. 2019) complicate the spectrum at low energies.
The detection of radio emission during the X-ray outburst is a surprising result (van den Eijnden et al. 2018). Radio emission in X-ray binaries with no (black hole binaries) or weak (low-mass neutron star binaries) magnetic field are common and attributed to the formation of a relativistic jet (Fender et al. 2004; Migliari & Fender 2006). However, it was believed that a strong magnetic field, such as the field in accreting X-ray pulsars, inhibits jet formation. The detection of radio emission in Swift J0243.6+6124 (a high-mass neutron star binary) has also been interpreted as coming from a jet based on the correlation between X-ray and radio luminosities, and on the radio spectral index evolution (van den Eijnden et al. 2018). Nevertheless, the fact that the radio luminosity in Swift J0243.6+6124 is two orders of magnitude fainter than seen in other neutron stars at similar X-ray luminosities implies that the magnetic field still plays an important role in regulating the jet power.
Several authors have derived different values for the distance, from ∼2 kpc based on optical photometric observations (Bikmaev et al. 2017) to ∼5 − 6 kpc based on the spin-up rate and accretion-torque models (Doroshenko et al. 2018; Zhang et al. 2019). Although the distance estimated from Gaia at face value is ∼7 kpc (Bailer-Jones et al. 2018), a strong lower limit of d > 5 kpc is found when all possible uncertainties in the Gaia analysis are taken into account (van den Eijnden et al. 2018). Even when this lower limit is assumed for the distance, the peak of 1 × 1039 erg s−1 implies that the Eddington limit for the neutron star was exceeded during the outburst.
While there are numerous studies of Swift J0243.6+6124 in the X-ray band (Wilson-Hodge et al. 2018; Doroshenko et al. 2018; Tsygankov et al. 2018; Jaisawal et al. 2019; Tao et al. 2019; van den Eijnden et al. 2019; Zhang et al. 2019; Doroshenko et al. 2020; Sugizaki et al. 2020), a detailed optical analysis is yet to be performed. A few days after its discovery in the X-ray band, we carried out the first optical spectroscopic observations from the 1.3 m telescope at the Skinakas Observatory (Kouroubatzakis et al. 2017). A strong Hα line in emission and a blue-end spectrum that resembled that of an early-type star led us to propose that Swift J0243.6+6124 is a new Be/X-ray binary (BeXB). We here perform the first detailed analysis of the optical counterpart to Swift J0243.6+6124 and confirm this system as a new Be/X-ray binary.
2. Observations
2.1. Spectroscopy
Optical spectroscopic observations were obtained from the 1.3 m telescope of the Skinakas observatory (SKO) in Crete (Greece). In addition, Swift J0243.6+6124 was observed in service time with the William Herschel Telescope (WHT) on the nights of 30 October 2017 and 9 February 2020. The 1.3 m telescope of the Skinakas Observatory was equipped with a 2048 × 2048 (13.5 micron) pixels ANDOR IKON CCD and a 1302 l mm−1 grating, giving a nominal dispersion of ∼0.8 Å pixel−1. The setup during the WHT observations was the ISIS spectrograph with the Red+ and EEV12 CCDs for the red and blue arm, respectively. The blue-sensitive EEV12 has an array of 4096 × 2048 (13.5 micron) pixels, offering 0.23 Å pixel−1. The default detector for the ISIS red arm is a red-sensitive array of 4096 × 2048 (15.0 micron) pixels with almost no fringing, giving 0.26 Å pixel−1. Spectra of comparison lamps were taken before each exposure in order to account for small variations of the wavelength calibration during the night. To ensure an homogeneous processing of the spectra, all of them were normalized with respect to the local continuum, which was rectified to unity by employing a spline fit. The log of the spectroscopic observations is given in Table 1.
Log of the spectroscopic observations.
2.2. Photometry
2.2.1. Skinakas observatory
Photometric observations with the Johnson-Cousins B, V, R, and I filters were made with the 1.3 m telescope of the Skinakas Observatory. The telescope was equipped with a 2048 × 2048 ANDOR CCD with a 13.5 μm pixel size. In this configuration, the plate scale is 0.28″ pixel−1, hence providing a field of view of 9.5 × 9.5 arcmin2. Standard stars from the Landolt list (Landolt 2009) were used for the transformation equations. The data were reduced in the standard way using the IRAF tools for aperture photometry. After the standardization process, we finally assigned an error to the calibrated magnitudes of the target given by the rms of the residuals between the cataloged and calculated magnitudes of the standard stars. The photometric magnitudes are given in Table 2.
Photometric observations of the optical counterpart to Swift J0243.6+6124 from the Skinakas observatory.
2.2.2. Aras de los Olmos observatory
Photometric time series were obtained at the Aras de los Olmos Observatory (OAO), located in La Muela de Santa Catalina, near of the Aras de los Olmos town (Valencia, Spain), at an altitude of 1280 m. Observations were performed with the 0.5 m telescope equipped with a Finger Lakes Instruments ProLine PL16801 thermoelectrically cooled CCD camera. The 4096 × 4096 array with a 2 × 2 binning gives a plate scale of 1.08″ pixel−1 and a field of view of 36.9 × 36.9 arcmin2. We performed differential photometry of Swift J0243.6+6124 in the Johnson B and V band for five nights between 3 and 26 October 2019, and six more nights between 3 and 15 February 2020 (Table 3). We transformed the differential instrumental magnitudes into calibrated magnitudes using the measurements of the reference star Gaia 465628266540345216 (α: 02 43 38.23, δ: +61 26 40.7, J2000) taken from the Skinakas observatory. The average magnitudes of the reference star are B = 13.67 ± 0.01, V = 13.02 ± 0.01, R = 12.65 ± 0.01, and I = 12.25 ± 0.02.
Fast-photometry observations from Aras de los Olmos Observatory and average B- and V-band magnitudes.
2.2.3. ASAS-SN light curve
We obtained the optical V-band light curve from the ASAS–SN Variable Stars Database (Shappee et al. 2014; Jayasinghe et al. 2019). The pixel scale in ASAS–SN is 8 arcsec, and the full width at half maximum (FWHM) is ∼2 pixels (Jayasinghe et al. 2019). This means that blending has a considerable effect on the data when a bright source lies within the FWHM. We used the results from the Gaia Data Release 2 (Evans et al. 2018) and found that there is a slightly fainter star at 6.2 arcsec from Swift J0243.6+6124. The calibrated V-band magnitude of this star, obtained from Skinakas data, is V = 14.52 ± 0.01 mag. We corrected our observed magnitudes for contamination by removing the brightness of the close star from the total observed flux because we considered that it is included in the photometric aperture. The applied corrections slightly varied depending on the variable flux of Swift J0243.6+6124, but they are in the range ΔV = 0.18 ± 0.01 mag. Finally, we also used six observations from the AAVSO obtained in the interval MJD 58532–58556.
2.2.4. (Neo)WISE photometry
We extracted the light curves in the W1 (3.4 μm) and W2 (4.6 μm) bands provided by the Wide-field Infrared Survey Explorer (WISE; Wright et al. 2010) and NeoWISE (Mainzer et al. 2011) missions through the IRSA interface1.
3. Results
3.1. Spectral classification
Figure 1 shows the spectrum of Swift J0243.6+6124 in the visible band. The numerous He I and He II lines indicate that the optical companion to Swift J0243.6+6124 is an early-type star. The emission lines of the Balmer and Paschen series imply the presence of circumstellar material where stellar light is absorbed and reemitted. These characteristics are typical of Be stars. This means that Swift J0243.6+6124 is a BeXB. To refine the spectral classification, we focus on the blue part of the optical spectrum, in particular, on the 4000−4600 Å region (Fig. 2), and follow the atlas and method of Walborn & Fitzpatrick (1990) and Gray & Corbally (2009). In the bottom panels of Fig. 2 we compare the two WHT spectra taken in October 2017 and February 2020. The latest spectrum is less affected by disk emission, as is apparent in the Hγ and Hδ lines.
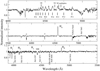 |
Fig. 1. Optical spectrum of Swift J0243.6+6124. The data were taken from the Skinakas observatory on 15 October 2017. |
The presence of He I and He II lines, moderate Si IV 4089, the absence of Mg II 4481, and the weakness of Si III 4552-68 indicate a type earlier than B0.5 Although He II 4686 and He II 4541 are strong, the ratio between He I 4387 and He II 4541 is clearly greater than 1, which implies a O9.5 star. This ratio is ∼1 for spectral type O9 and reverses for hotter stars. Likewise, the comparable intensity of He II 4686 and the C III + O II blend at 4650 Å (Fig. 1) together with the weak He II 4200 rules out a type earlier than O9. For example, an O8–O8.5V would have He II 4686 ≫ CIII + OII as well as He II 4200 ≫ He I 4121−4143.
Some traces of Si IV 4116 may be present but very weak. The ratio Si IV 4116/He I 4121 ≪ 1 favors a O9−B0. It also suggests a luminosity class V because in giants and supergiants, this ratio is ≫1. The strength of the He II lines also indicates a luminosity class V. The absorption strength of this line weakens in giants and supergiants.
In the red part of the spectrum, from P11 to P21, together with the conspicuous Paschen lines series, the O I 8446 line is in emission and blended with P18. The N I 8680-8683-8686 multiplet, blended in a single broad feature, also appears in emission near the right wing of the P13 line. The other N I features in this spectral range, the 8629 Å line and the 8703-8712-8719 multiplet, are marginally detected in emission. When these lines are detected in Be stars, they are always present in emission in early spectral subtypes up to B2.5 (Andrillat et al. 1988). We conclude that the most likely spectral type of the companion of Swift J0243.6+6124 is O9.5Ve.
3.2. Reddening and distance
To estimate the distance through the distance-modulus relation, V − MV − AV = 5log(d)−5, the amount of interstellar extinction AV = R × E(B − V) to the source has to be determined. We used two methods to derive the color excess E(B − V). The most direct method is to use the calibrated color of the star according to the spectral type. The color excess is defined as E(B − V) = (B − V)obs − (B − V)0, where (B − V)obs is the observed color and (B − V)0 is the intrinsic color of the star. The second method uses the strength of certain interstellar lines to estimate the interstellar reddening (Herbig 1975; Herbig & Leka 1991; Galazutdinov et al. 2000; Friedman et al. 2011; Kos & Zwitter 2013).
The 2019 photometric observations gave (B − V)obs = 0.95 ± 0.02 in July and (B − V)obs = 0.97 ± 0.02 in September. The observed color depends on the spectral type of the star. Based on our derivation of the spectral type, the expected color for an O9.5V star is (B − V)0 = −0.29 ± 0.02. This value is the average of the calibrations from Johnson (1966), Fitzgerald (1970), Gutierrez-Moreno (1979), Wegner (1994), and Pecaut & Mamajek (2013) and the error is the standard deviation of the five values. The color excess is then estimated to be E(B − V) = 1.24 ± 0.02.
The color excess can also be estimated from the strength of the diffuse interstellar bands (DIB). When the strongest and cleanest lines (5780 Å and 6613 Å) in the red spectrum of Swift J0243.6+6124 and the calibrations of Herbig (1975) and Friedman et al. (2011) are used, the estimated color excess is E(B − V) = 1.1 ± 0.2, in agreement with the photometric derived value. The error is the standard deviation of all measurements.
When the standard extinction law R = 3.1 is used, the extinction in the V band is then AV = R × E(B − V) = 3.41 − 3.84 mag. This lies in between the extinction along the line of sight of Swift J0243.6+6124 given by the reddening analysis of Schlafly & Finkbeiner (2011; AV = 3.48 mag) and Schlegel et al. (1998; AV = 4.19 mag)2. With the photometrically derived value of the color excess, AV = 3.84, V = 12.90 ± 0.02, and an absolute magnitude for an O9.5V star of MV = −4.2, obtained as the average from the calibrations of Humphreys & McElroy (1984), Vacca et al. (1996), Martins et al. (2005), Wegner (2006), and Pecaut & Mamajek (2013), the distance to Swift J0243.6+6124 is estimated to be 4.5 ± 0.5 kpc.
There are a number of uncertainties in the derivation of the distance using photometry that are related to the uncertainty in the calibrations of the absolute magnitude and colors associated with the spectral type and luminosity class. Differences of 0.04 mag in intrinsic (B − V)0 are found in studies from different authors. Likewise, the relation between absolute magnitude and luminosity has a large intrinsic dispersion (Jaschek & Gómez 1998; Wegner 2006). The error in the distance was obtained by propagating the errors 0.02 mag in V and E(B − V) and 0.2 mag in MV.
The fact that the optical companion to Swift J0243.6+6124 is an OBe star adds another source of uncertainty in the determination of the distance. The presence of the circumstellar disk means that the photometric magnitudes and colors may be contaminated by disk emission. The overall effect is to cause the star to appear redder, that is, to be seen at higher extinction (Fabregat & Reglero 1990; Riquelme et al. 2012). As a result, the distance estimate that is obtained from photometric magnitudes that may be affected by disk emission should be taken as a lower limit. The photometric observations that we used to derive the distance of ∼4.5 kpc corresponded to the lowest value of the Hα equivalent width (EW(Hα)), that is, when the contribution of the disk was expected to be minimum. Some residual emission is still present (Table 1). When the additional reddening from the disk is taken into account and Eq. (21) from Riquelme et al. (2012) is applied, the distance increases to 4.8 ± 0.5 kpc. The value of the EW(Hα) used in this correction is derived from the EW(Hα) of the measured spectrum (−5.8 Å, Table 1) and the fill-in emission that corresponds to an O9.5V star (2.5 Å, see, e.g., Table 4 in Riquelme et al. 2012).
When we instead use the color excess from the DIB analysis, we obtain a distance of 5.5 ± 1.7 kpc. Here the main source of error lies in the uncertainty of E(B − V).
Our value of the distance is similar to that obtained from an X-ray analysis of the correlation between the spin-up rate and the magnetic field of the neutron star of ∼5 kpc (Doroshenko et al. 2018). Based on Gaia observations, van den Eijnden et al. (2018) set a lower limit of 5 kpc, while the Gaia catalog (Bailer-Jones et al. 2018) gives  kpc.
kpc.
3.3. Rotational velocity
The rotational velocity is an important parameter that it is linked to the formation of the circumstellar disk and allows us to estimate the velocity law of the gas particles in the disk (see, e.g., the discussion in Reig et al. 2016). Because Be stars are fast rotators that likely spin at close to the critical rotation rate at which centrifugal forces balance Newtonian gravity, the effective equatorial gravity is reduced to the extent that weak processes such as gas pressure and/or nonradial pulsations alone or in combination with magnetic flaring activity may trigger the ejection of photospheric matter with sufficient energy and angular momentum to form a Keplerian disk.
The use of optical spectra to estimate the rotational velocity is based on the fact that stellar absorption lines are rotationally broadened. Thus the projected rotational velocity, v sin i, where v is the equatorial rotational velocity and i is the inclination angle toward the observer, can be estimated by measuring the width of lines that are not affected by the disk contribution. He I lines are significantly less affected by disk emission than hydrogen lines and are considerably stronger than other metallic lines. Thus we estimated the projected rotational velocity by measuring the FWHM of the He I lines.
For this analysis, we used the WHT spectra taken on the night of 9 February 2020 as it provides the highest spectral resolution and the least contamination from disk emission (see Fig. 2). Nevertheless, we note that some level of the disk emission remains in H and He lines, as implied by the fact that the Hα line showed an emission profile with EW(Hα) = −7.5 Å. Residual emission has the effect to increase the width of the line because the FWHM is measured not at half maximum (or minimum for an absorption line), but closer to the continuum where the line profile is broader.
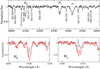 |
Fig. 2. Optical spectrum showing the most relevant lines for spectral classification. The spectrum in the top panel was obtained with the WHT (0.22 Å pixel−1) on 9 February 2020. Bottom panels: display the spectrum taken with the WHT on 30 October 2017 (black), i.e., near the peak of the X-ray outburst, and on 9 February 2020 (red). The spectra were smoothed with a Gaussian filter with an FWHM of 0.7 Å. |
We fit a Gaussian profile and derived the FWHM of four He I lines (4026 Å, 4143 Å, 4387 Å, and 4471 Å) on each one of the two spectra taken by WHT on the night of 9 February 2020 as well as on the average. We repeated the procedure three times, which corresponds to different selections of the continuum. The final rotational velocity is the mean of all these measurements. The conversion from the FWHM into velocity was made using the calibration by Steele et al. (1999), after correcting for instrumental broadening (FWHMins = 55 km s−1). The average and standard deviation gave v sin i = 210 ± 20 km s−1. Table 4 compares the rotational velocity of Swift J0243.6+6124 with other BeXBs.
Comparison of Swift J0243.6+6124 with other Be/X-ray binaries.
3.4. Fast photometry. Frequency analysis
We performed a frequency analysis of the Aras de los Olmos differential photometry data by means of the standard Fourier analysis techniques and least-squares fitting using the codes Period04 (Lenz & Breger 2005) and PASPER (Diago et al. 2008). These programs determine the frequency with the largest amplitude by performing a Fourier transform and then fitting the light curve with a sinusoidal function using a least-squares algorithm. Then this frequency is removed and a new search is performed. The method is iterative and ends when the removal of a new frequency is not statistically significant.
As a result of the analysis no significant frequency was found in the interval of 0 to 20 cycles day−1. The accuracy of the differential photometry, which is estimated as the standard deviation of the mean differential photometry between nonvariable reference stars in the field, amounts to 7 mmag in the B and V bands. We therefore conclude that no short-term variability with an amplitude larger than 7 mmag and frequency lower than 20 cycles day−1 was present in Swift J0243.6+6124 during the time span of our observations.
4. Discussion
The optical emission in BeXBs mainly comes from two different regions: the circumstellar disk, and the star itself. Long-term variations (on the order of months to years) are related to structural changes in the disk, while fast variability (of about some hours) is attributed to changes in the stellar photosphere. The nondetection of fast photometric variability in Swift J0243.6+6124 represents an additional peculiarity with respect to the common characteristics of the BeXB class. Short-term variability and intra-night photometric modulations are common among BeXBs (Reig et al., in prep.).
Figure 3 shows the long-term evolution of the optical parameters with time. The giant outburst that led to the discovery of the source as an X-ray transient in October 2017 is clearly seen in the top panel of this figure. The brightening during the years prior to the X-ray outburst and the subsequent decrease in the optical and infrared emission agree with a disk origin and is typical of BeXBs (Reig et al. 2016). Be star disks are known to form and dissipate on timescales of years. The disk emission increases with wavelength and becomes particularly significant in the infrared band. The optical and infrared light curves in Fig. 3 indicate that the disk grew steadily during the years prior to the X-ray outburst. The optical and infrared emission reached a local maximum in the weeks before the X-ray outburst occurred, clearly indicating that a large disk was already present by the time the X-ray outburst was detected. The disk radius most likely extended all the way up to the periastron distance.
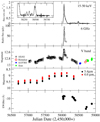 |
Fig. 3. Multiwavelength variability of Swift J0243.6+6124: Swift/BAT X-ray flux, radio flux (from van den Eijnden et al. 2018), V-band magnitude, NEOWISE infrared magnitudes at 3.4 μm and 4.6 μm, and EW(Hα). The inset in the top panel shows the series of type I outbursts that followed the main giant outburst. |
In about October 2017, the neutron star interacted with the disk, accreting a large amount of material and producing the large X-ray flare. After the main X-ray outburst, a series of type I outbursts followed. As a result of the X-ray activity, the disk weakened. This became evident by the significant decrease in the equivalent width of the Hα line from a maximum of −11 Å during the peak of the X-ray outburst (MJD 58031) to a minimum of −4.9 Å (MJD 58715) two years later. Further evidence for a smaller disk during the 2020 observation comes from the significantly lower fill-in emission that affects the Balmer lines compared to the October 2017 spectrum (see the bottom panels in Fig. 2).
The variability of the optical emission during the X-ray outburst is unusual among BeXBs, however. The optical and X-ray luminosity are strongly correlated without any significant delay. Smooth and slow variations in the optical light curve of Be stars in BeXB of a few tenths of magnitude are common and attributed to the disk formation and dissipation (Reig & Fabregat 2015). The optical and infrared brightening of the Be star normally precedes the appearance of X-ray outbursts in BeXBs (Stevens et al. 1997; Coe et al. 2006; Reig et al. 2007; Camero-Arranz et al. 2012; Camero et al. 2014; Caballero-García et al. 2016; Alfonso-Garzón et al. 2017). Although long-term photometric coverage with good cadence is scarce for BeXBs, the available data show that this long-term variability is gradual and slow and contrasts with the sudden increase and subsequent decrease that is observed during the X-ray outburst in Swift J0243.6+6124. The tight correlation between the X-ray, radio, and V-band emission during the X-ray outburst suggests a strong link between the processes that give rise to the emission at the different wavelength bands. A detailed study of the optical outburst and its correlation with the X-ray flux will be presented in a forthcoming paper (Alfonso-Garzón et al., in prep.).
The profile of the Hα line provides further information about the state of the circumstellar disk. Be stars show a wide range of different shapes. These shapes are attributed to different inclination angles (Slettebak 1979; Rivinius et al. 2013, but see also Silaj et al. 2010). At low inclination, the line typically shows a single-peak profile. At intermediate angles, Be stars exhibit a double-peak profile. The double-peak structure is a natural consequence of rotation velocity prevailing over radial displacements. At high inclination, the double-peak presents a central depression caused by self absorption from the disk (shell profile).
Unfortunately, the low spectral resolution of our observations does not allow a detailed study of the changes in the shape of the line, but the data show that Swift J0243.6+6124 displayed a single-peaked profile that turned into a double-peaked profile at low values of EW(Hα) (Fig. 4). This is the expected behavior in Keplerian disks, where the rotational velocity of the gas particles in the disk varies as vϕ ∝ r−1/2. Because the peak separation in a double-peaked profile is directly linked with this velocity, the peaks separation increases when the disk radius decreases. Nevertheless, even with the high spectral resolution provided by the WHT spectrum, the double peak is not clearly distinguishable. This suggests that we see the circumstellar disk at a small inclination angle and that it resembles the behavior of V 0332+54, which always displays a single-peak line (Reig et al. 2016; Caballero-García et al. 2016). The inclination of V 0332+54 is estimated to be i < 20° (Negueruela et al. 1999; Zhang et al. 2005). Further evidence for a low-inclination angle is given by the WHT spectrum, which has a higher resolution and was obtained near the peak of the outburst. This spectrum displays inflections in the flanks of the profile that are reminiscent of a wine-bottle profile. This type of profile results from noncoherent scattering broadening that is caused by the optical thickness of the Hα line in the direction perpendicular to the disk plane and appears at small inclination angles (Hanuschik 1986; Hummel & Vrancken 1995; Hummel & Hanuschik 1997).
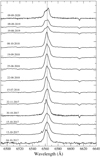 |
Fig. 4. Evolution of the Hα line profile. The vertical line marks the rest wavelength of the Hα line. |
On the other hand, we can roughly estimate the inclination of the orbital plane from the orbital solution. The projected semimajor axis is a sin i ∼ 116 lt-s (or ∼50 R⊙) and the orbital period is 27.8 d (Wilson-Hodge et al. 2018; Zhang et al. 2019). When we assume typical masses for the O9.5V star and neutron star of 16 M⊙ and 1.4 M⊙, we obtain from the third Kepler law a ∼ 100 R⊙. Hence i ∼ 30°.
4.1. Giant X-ray outburst
Current models that explain giant (type II) X-ray outbursts in BeXBs are based on the idea that these outbursts occur when the neutron star captures a large amount of gas from a warped (Martin et al. 2011; Okazaki et al. 2013; Moritani et al. 2013) or a highly eccentric disk (Martin et al. 2014). The warping of the disk may be caused by the tidal interaction with the neutron star (Martin et al. 2011) or by radiation from the central star (Porter 1998), whereas the main mechanism that has been identified to produce eccentricity growth is Kozai-Lidov oscillations (Martin & Franchini 2019, but see also Martin et al. 2014). In either case, the unavoidable condition for these two processes (warping and eccentricity growth) to work is the misalignment of the decretion disk. In other words, the disk must be tilted. However, the two mechanisms differ in the value of the initial tilt angle, that is, the angle between the spin axis of the Be star and that of the binary orbit, or angle between the orbital plane and the Be disk. While the tidal torque scenario favors small tilt angles, β < 20° (Okazaki et al. 2013), the eccentric disk scenario is expected only in systems with a large misalignment β > 60° (Martin et al. 2014). From the point of view of the observations, evidence for misaligned disks during X-ray outbursts comes from the variability in the shape of the spectral emission lines (Negueruela et al. 2001; Moritani et al. 2011, 2013) and changes in the polarization angle (Reig & Blinov 2018).
Although we do not have optical spectra prior to the 2017 X-ray outburst that would allow us to gauge possible inclination effects from changes in the line profile, the data provide some evidence for a small tilt angle. We estimated the orbital inclination to be ∼30°, while we argued that the single peak and inflections in the flanks of the Hα line (wine-bottle profile) also favor a small disk inclination. Indeed, Swift J0243.6+6124 shows some elements that could be the result of a warped disk, or more generally, of an asymmetrical distribution of matter in the disk. The X-ray activity of Swift J0243.6+6124 continued after the major outburst for about a year in the form of minor orbitally modulated (Porb = 28 d) outbursts. The peak intensity of these minor outbursts was distributed irregularly, with values in the range ∼0.02 − 0.2 BAT counts cm−2 s−1, without any ordered time sequence. This irregularity could be interpreted as the neutron star probing different parts of the disk with different density at each periastron passage as a result of a warped disk. The optical emission also shows some features that could be attributed to an inhomogeneous disk (see Fig. 3): the local minimum at ∼MJD 58000 (about one month before the onset of the outburst) in the V-band light curve, the sudden decrease in the equivalent width of the Hα line by ∼10% during the rise at MJD 58040, and the rebrightening in V mag during the decay at around MJD 58100.
After the outburst, the outer parts of the disk disappeared because they were accreted onto the neutron star. The disk, however, did not seem to return to a normal quiescent state until after the end of the X-ray activity at around MJD 58550.
5. Conclusion
The long-term optical variability of Swift J0243.6+6124 is typical of BeXBs. The disk grew until its radius became about as large as the periastron distance. This growth led to mass transfer onto the neutron star and caused a giant X-ray outburst. After the outburst, the decrease in optical continuum emission and in the strength of the Hα line indicated that the disk weakened. However, a disk-loss episode never occurred. The latest observations suggest that a new growth phase has begun. We speculate that a warped disk is responsible for the X-ray variability that was observed during and after the main outburst. While the long-term optical variability does not reveal any peculiarity that could explain the unique nature of Swift J0243.6+6124, the lack of fast photometric variability driven by nonradial pulsations is surprising.
Obtained using the Nasa Extragalactic Database extinction calculator (https://ned.ipac.caltech.edu/extinction_calculator).
Acknowledgments
Skinakas Observatory is run by the University of Crete and the Foundation for Research and Technology-Hellas. The Aras de los Olmos Observatory (OAO) is a facility of the Astronomical Observatory of the Valencia University (Spain). We thank O. Breviá and V. Peris for their support to the OAO observations. This proposal benefited by the WHT Service proposals SW2017b10 and SW2019b18. The WHT and its service program are operated on the island of La Palma by the Isaac Newton Group of Telescopes in the Spanish Observatorio del Roque de los Muchachos of the Instituto de Astrofísica de Canarias. This publication makes use of data products from the Wide-field Infrared Survey Explorer, which is a joint project of the University of California, Los Angeles, and the Jet Propulsion Laboratory/California Institute of Technology, funded by the National Aeronautics and Space Administration. This publication also makes use of data products from NEOWISE, which is a project of the Jet Propulsion Laboratory/California Institute of Technology, funded by the Planetary Science Division of the National Aeronautics and Space Administration.
References
- Alfonso-Garzón, J., Fabregat, J., Reig, P., et al. 2017, A&A, 607, A52 [CrossRef] [EDP Sciences] [Google Scholar]
- Andrillat, Y., Jaschek, M., & Jaschek, C. 1988, A&AS, 72, 129 [NASA ADS] [Google Scholar]
- Bahramian, A., Kennea, J. A., & Shaw, A. W. 2017, ATel, 10866, 1 [Google Scholar]
- Bailer-Jones, C. A. L., Rybizki, J., Fouesneau, M., Mantelet, G., & Andrae, R. 2018, AJ, 156, 58 [NASA ADS] [CrossRef] [Google Scholar]
- Bikmaev, I., Shimansky, V., Irtuganov, E., et al. 2017, ATel, 10968, 1 [Google Scholar]
- Caballero-García, M. D., Camero-Arranz, A., Özbey Arabacı, M., et al. 2016, A&A, 589, A9 [NASA ADS] [CrossRef] [EDP Sciences] [Google Scholar]
- Camero, A., Zurita, C., Gutiérrez-Soto, J., et al. 2014, A&A, 568, A115 [NASA ADS] [CrossRef] [EDP Sciences] [Google Scholar]
- Camero-Arranz, A., Finger, M. H., Wilson-Hodge, C. A., et al. 2012, ApJ, 754, 20 [NASA ADS] [CrossRef] [Google Scholar]
- Coe, M. J., Reig, P., McBride, V. A., Galache, J. L., & Fabregat, J. 2006, MNRAS, 368, 447 [NASA ADS] [CrossRef] [Google Scholar]
- Delgado-Martí, H., Levine, A. M., Pfahl, E., & Rappaport, S. A. 2001, ApJ, 546, 455 [NASA ADS] [CrossRef] [Google Scholar]
- Diago, P. D., Gutiérrez-Soto, J., Fabregat, J., & Martayan, C. 2008, A&A, 480, 179 [NASA ADS] [CrossRef] [EDP Sciences] [Google Scholar]
- Doroshenko, V., Tsygankov, S., & Santangelo, A. 2018, A&A, 613, A19 [NASA ADS] [CrossRef] [EDP Sciences] [Google Scholar]
- Doroshenko, V., Zhang, S. N., Santangelo, A., et al. 2020, MNRAS, 491, 1857 [Google Scholar]
- Evans, D. W., Riello, M., De Angeli, F., et al. 2018, A&A, 616, A4 [NASA ADS] [CrossRef] [EDP Sciences] [Google Scholar]
- Fabregat, J., & Reglero, V. 1990, MNRAS, 247, 407 [NASA ADS] [Google Scholar]
- Fender, R. P., Belloni, T. M., & Gallo, E. 2004, MNRAS, 355, 1105 [NASA ADS] [CrossRef] [Google Scholar]
- Ferrigno, C., Farinelli, R., Bozzo, E., et al. 2013, A&A, 553, A103 [NASA ADS] [CrossRef] [EDP Sciences] [Google Scholar]
- Fitzgerald, M. P. 1970, A&A, 4, 234 [NASA ADS] [Google Scholar]
- Friedman, S. D., York, D. G., McCall, B. J., et al. 2011, ApJ, 727, 33 [NASA ADS] [CrossRef] [Google Scholar]
- Galazutdinov, G. A., Musaev, F. A., Krełowski, J., & Walker, G. A. H. 2000, PASP, 112, 648 [NASA ADS] [CrossRef] [Google Scholar]
- Gray, R. O., & Corbally, C. J. 2009, Stellar Spectral Classification (Princeton: Princeton University Press) [Google Scholar]
- Grundstrom, E. D., Boyajian, T. S., Finch, C., et al. 2007, ApJ, 660, 1398 [NASA ADS] [CrossRef] [Google Scholar]
- Gutierrez-Moreno, A. 1979, PASP, 91, 299 [NASA ADS] [CrossRef] [Google Scholar]
- Haigh, N. J., Coe, M. J., & Fabregat, J. 2004, MNRAS, 350, 1457 [NASA ADS] [CrossRef] [Google Scholar]
- Hanuschik, R. W. 1986, A&A, 166, 185 [NASA ADS] [Google Scholar]
- Herbig, G. H. 1975, ApJ, 196, 129 [NASA ADS] [CrossRef] [Google Scholar]
- Herbig, G. H., & Leka, K. D. 1991, ApJ, 382, 193 [NASA ADS] [CrossRef] [Google Scholar]
- Hummel, W., & Hanuschik, R. W. 1997, A&A, 320, 852 [NASA ADS] [Google Scholar]
- Hummel, W., & Vrancken, M. 1995, A&A, 302, 751 [NASA ADS] [Google Scholar]
- Humphreys, R. M., & McElroy, D. B. 1984, ApJ, 284, 565 [NASA ADS] [CrossRef] [Google Scholar]
- Jaisawal, G. K., Wilson-Hodge, C. A., Fabian, A. C., et al. 2019, ApJ, 885, 18 [CrossRef] [Google Scholar]
- Janot-Pacheco, E., Ilovaisky, S. A., & Chevalier, C. 1981, A&A, 99, 274 [NASA ADS] [Google Scholar]
- Janot Pacheco, E., Chevalier, C., & Ilovaisky, S. A. 1982, in Be Stars, eds. M. Jaschek, & H. G. Groth, IAU Symp., 98, 151 [NASA ADS] [CrossRef] [Google Scholar]
- Jaschek, C., & Gómez, A. E. 1998, Highlights Astron., 11, 566 [Google Scholar]
- Jayasinghe, T., Stanek, K. Z., Kochanek, C. S., et al. 2019, MNRAS, 486, 1907 [NASA ADS] [Google Scholar]
- Jenke, P., & Wilson-Hodge, C. A. 2017, ATel, 10812, 1 [Google Scholar]
- Johnson, H. L. 1966, ARA&A, 4, 193 [NASA ADS] [CrossRef] [Google Scholar]
- Kennea, J. A., Lien, A. Y., Krimm, H. A., Cenko, S. B., & Siegel, M. H. 2017, ATel, 10809, 1 [Google Scholar]
- Kos, J., & Zwitter, T. 2013, ApJ, 774, 72 [NASA ADS] [CrossRef] [Google Scholar]
- Kouroubatzakis, K., Reig, P., Andrews, J., & Zezas, A. 2017, ATel, 10822, 1 [Google Scholar]
- Landolt, A. U. 2009, AJ, 137, 4186 [NASA ADS] [CrossRef] [Google Scholar]
- Lenz, P., & Breger, M. 2005, Commun. Asteroseismol., 146, 53 [NASA ADS] [CrossRef] [Google Scholar]
- Lyubimkov, L. S., Rostopchin, S. I., Roche, P., & Tarasov, A. E. 1997, MNRAS, 286, 549 [NASA ADS] [CrossRef] [Google Scholar]
- Mainzer, A. K., Bauer, J. M., Grav, T., et al. 2011, Lunar and Planetary Science Conference, 1121 [Google Scholar]
- Martin, R. G., & Franchini, A. 2019, MNRAS, 489, 1797 [CrossRef] [Google Scholar]
- Martin, R. G., Pringle, J. E., Tout, C. A., & Lubow, S. H. 2011, MNRAS, 416, 2827 [NASA ADS] [CrossRef] [Google Scholar]
- Martin, R. G., Nixon, C., Armitage, P. J., Lubow, S. H., & Price, D. J. 2014, ApJ, 790, L34 [NASA ADS] [CrossRef] [Google Scholar]
- Martins, F., Schaerer, D., & Hillier, D. J. 2005, A&A, 436, 1049 [NASA ADS] [CrossRef] [EDP Sciences] [Google Scholar]
- Migliari, S., & Fender, R. P. 2006, MNRAS, 366, 79 [NASA ADS] [CrossRef] [Google Scholar]
- Moritani, Y., Nogami, D., Okazaki, A. T., et al. 2011, PASJ, 63, 25 [NASA ADS] [CrossRef] [Google Scholar]
- Moritani, Y., Nogami, D., Okazaki, A. T., et al. 2013, PASJ, 65, 83 [NASA ADS] [Google Scholar]
- Negueruela, I., & Okazaki, A. T. 2001, A&A, 369, 108 [NASA ADS] [CrossRef] [EDP Sciences] [Google Scholar]
- Negueruela, I., Roche, P., Fabregat, J., & Coe, M. J. 1999, MNRAS, 307, 695 [NASA ADS] [CrossRef] [Google Scholar]
- Negueruela, I., Okazaki, A. T., Fabregat, J., et al. 2001, A&A, 369, 117 [NASA ADS] [CrossRef] [EDP Sciences] [Google Scholar]
- Okazaki, A. T., Hayasaki, K., & Moritani, Y. 2013, PASJ, 65, 41 [NASA ADS] [Google Scholar]
- Parkes, G. E., Murdin, P. G., & Mason, K. O. 1980, MNRAS, 190, 537 [NASA ADS] [CrossRef] [Google Scholar]
- Pecaut, M. J., & Mamajek, E. E. 2013, ApJS, 208, 9 [Google Scholar]
- Porter, J. M. 1998, A&A, 336, 966 [NASA ADS] [Google Scholar]
- Reig, P., & Blinov, D. 2018, A&A, 619, A19 [CrossRef] [EDP Sciences] [Google Scholar]
- Reig, P., & Fabregat, J. 2015, A&A, 574, A33 [NASA ADS] [CrossRef] [EDP Sciences] [Google Scholar]
- Reig, P., & Zezas, A. 2014, A&A, 561, A137 [NASA ADS] [CrossRef] [EDP Sciences] [Google Scholar]
- Reig, P., Fabregat, J., Coe, M. J., et al. 1997, A&A, 322, 183 [NASA ADS] [Google Scholar]
- Reig, P., Negueruela, I., Buckley, D. A. H., et al. 2001, A&A, 367, 266 [NASA ADS] [CrossRef] [EDP Sciences] [Google Scholar]
- Reig, P., Negueruela, I., Fabregat, J., et al. 2004, A&A, 421, 673 [NASA ADS] [CrossRef] [EDP Sciences] [Google Scholar]
- Reig, P., Negueruela, I., Fabregat, J., Chato, R., & Coe, M. J. 2005, A&A, 440, 1079 [NASA ADS] [CrossRef] [EDP Sciences] [Google Scholar]
- Reig, P., Larionov, V., Negueruela, I., Arkharov, A. A., & Kudryavtseva, N. A. 2007, A&A, 462, 1081 [NASA ADS] [CrossRef] [EDP Sciences] [Google Scholar]
- Reig, P., Zezas, A., & Gkouvelis, L. 2010, A&A, 522, A107 [NASA ADS] [CrossRef] [EDP Sciences] [Google Scholar]
- Reig, P., Nersesian, A., Zezas, A., Gkouvelis, L., & Coe, M. J. 2016, A&A, 590, A122 [NASA ADS] [CrossRef] [EDP Sciences] [Google Scholar]
- Reig, P., Blay, P., & Blinov, D. 2017, A&A, 598, A16 [CrossRef] [EDP Sciences] [Google Scholar]
- Riquelme, M. S., Torrejón, J. M., & Negueruela, I. 2012, A&A, 539, A114 [NASA ADS] [CrossRef] [EDP Sciences] [Google Scholar]
- Rivinius, T., Carciofi, A. C., & Martayan, C. 2013, A&ARv, 21, 69 [Google Scholar]
- Schlafly, E. F., & Finkbeiner, D. P. 2011, ApJ, 737, 103 [NASA ADS] [CrossRef] [Google Scholar]
- Schlegel, D. J., Finkbeiner, D. P., & Davis, M. 1998, ApJ, 500, 525 [NASA ADS] [CrossRef] [Google Scholar]
- Shappee, B., Prieto, J., Stanek, K. Z., et al. 2014, Am. Astron. Soc. Meet. Abstr., #223, 236.03 [Google Scholar]
- Silaj, J., Jones, C. E., Tycner, C., Sigut, T. A. A., & Smith, A. D. 2010, ApJS, 187, 228 [NASA ADS] [CrossRef] [Google Scholar]
- Slettebak, A. 1979, Space Sci. Rev., 23, 541 [NASA ADS] [CrossRef] [Google Scholar]
- Staubert, R., Pottschmidt, K., Doroshenko, V., et al. 2011, A&A, 527, A7 [NASA ADS] [CrossRef] [EDP Sciences] [Google Scholar]
- Steele, I. A., Negueruela, I., & Clark, J. S. 1999, A&AS, 137, 147 [NASA ADS] [CrossRef] [EDP Sciences] [Google Scholar]
- Stevens, J. B., Reig, P., Coe, M. J., et al. 1997, MNRAS, 288, 988 [NASA ADS] [CrossRef] [Google Scholar]
- Sugizaki, M., Oeda, M., Kawai, N., et al. 2020, ApJ, 896, 124 [CrossRef] [Google Scholar]
- Tao, L., Feng, H., Zhang, S., et al. 2019, ApJ, 873, 19 [CrossRef] [Google Scholar]
- Tsygankov, S. S., Doroshenko, V., Mushtukov, A. E. A., Lutovinov, A. A., & Poutanen, J. 2018, MNRAS, 479, L134 [NASA ADS] [CrossRef] [Google Scholar]
- Vacca, W. D., Garmany, C. D., & Shull, J. M. 1996, ApJ, 460, 914 [NASA ADS] [CrossRef] [Google Scholar]
- van den Eijnden, J., Degenaar, N., Russell, T. D., et al. 2018, Nature, 562, 233 [NASA ADS] [CrossRef] [Google Scholar]
- van den Eijnden, J., Degenaar, N., Schulz, N. S., et al. 2019, MNRAS, 487, 4355 [CrossRef] [Google Scholar]
- Walborn, N. R., & Fitzpatrick, E. L. 1990, PASP, 102, 379 [Google Scholar]
- Wegner, W. 1994, MNRAS, 270, 229 [NASA ADS] [CrossRef] [Google Scholar]
- Wegner, W. 2006, MNRAS, 371, 185 [NASA ADS] [CrossRef] [Google Scholar]
- Wilson-Hodge, C. A., Malacaria, C., Jenke, P. A., et al. 2018, ApJ, 863, 9 [NASA ADS] [CrossRef] [Google Scholar]
- Wright, E. L., Eisenhardt, P. R. M., Mainzer, A. K., et al. 2010, AJ, 140, 1868 [Google Scholar]
- Zhang, S., Qu, J.-L., Song, L.-M., & Torres, D. F. 2005, ApJ, 630, L65 [NASA ADS] [CrossRef] [Google Scholar]
- Zhang, Y., Ge, M., Song, L., et al. 2019, ApJ, 879, 61 [CrossRef] [Google Scholar]
All Tables
Photometric observations of the optical counterpart to Swift J0243.6+6124 from the Skinakas observatory.
Fast-photometry observations from Aras de los Olmos Observatory and average B- and V-band magnitudes.
All Figures
|
Fig. 1. Optical spectrum of Swift J0243.6+6124. The data were taken from the Skinakas observatory on 15 October 2017. |
| In the text | |
|
Fig. 2. Optical spectrum showing the most relevant lines for spectral classification. The spectrum in the top panel was obtained with the WHT (0.22 Å pixel−1) on 9 February 2020. Bottom panels: display the spectrum taken with the WHT on 30 October 2017 (black), i.e., near the peak of the X-ray outburst, and on 9 February 2020 (red). The spectra were smoothed with a Gaussian filter with an FWHM of 0.7 Å. |
| In the text | |
|
Fig. 3. Multiwavelength variability of Swift J0243.6+6124: Swift/BAT X-ray flux, radio flux (from van den Eijnden et al. 2018), V-band magnitude, NEOWISE infrared magnitudes at 3.4 μm and 4.6 μm, and EW(Hα). The inset in the top panel shows the series of type I outbursts that followed the main giant outburst. |
| In the text | |
|
Fig. 4. Evolution of the Hα line profile. The vertical line marks the rest wavelength of the Hα line. |
| In the text | |
Current usage metrics show cumulative count of Article Views (full-text article views including HTML views, PDF and ePub downloads, according to the available data) and Abstracts Views on Vision4Press platform.
Data correspond to usage on the plateform after 2015. The current usage metrics is available 48-96 hours after online publication and is updated daily on week days.
Initial download of the metrics may take a while.