Fig. 2.
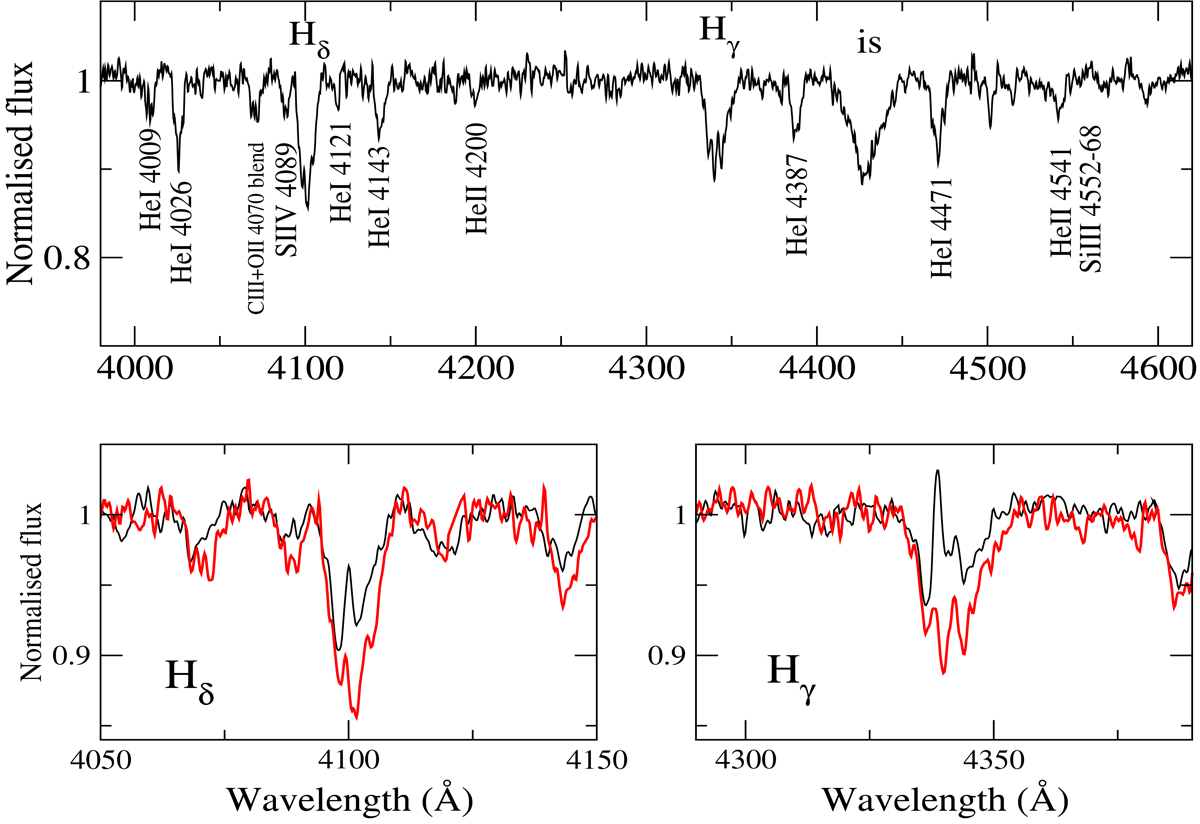
Optical spectrum showing the most relevant lines for spectral classification. The spectrum in the top panel was obtained with the WHT (0.22 Å pixel−1) on 9 February 2020. Bottom panels: display the spectrum taken with the WHT on 30 October 2017 (black), i.e., near the peak of the X-ray outburst, and on 9 February 2020 (red). The spectra were smoothed with a Gaussian filter with an FWHM of 0.7 Å.
Current usage metrics show cumulative count of Article Views (full-text article views including HTML views, PDF and ePub downloads, according to the available data) and Abstracts Views on Vision4Press platform.
Data correspond to usage on the plateform after 2015. The current usage metrics is available 48-96 hours after online publication and is updated daily on week days.
Initial download of the metrics may take a while.