Fig. 4.
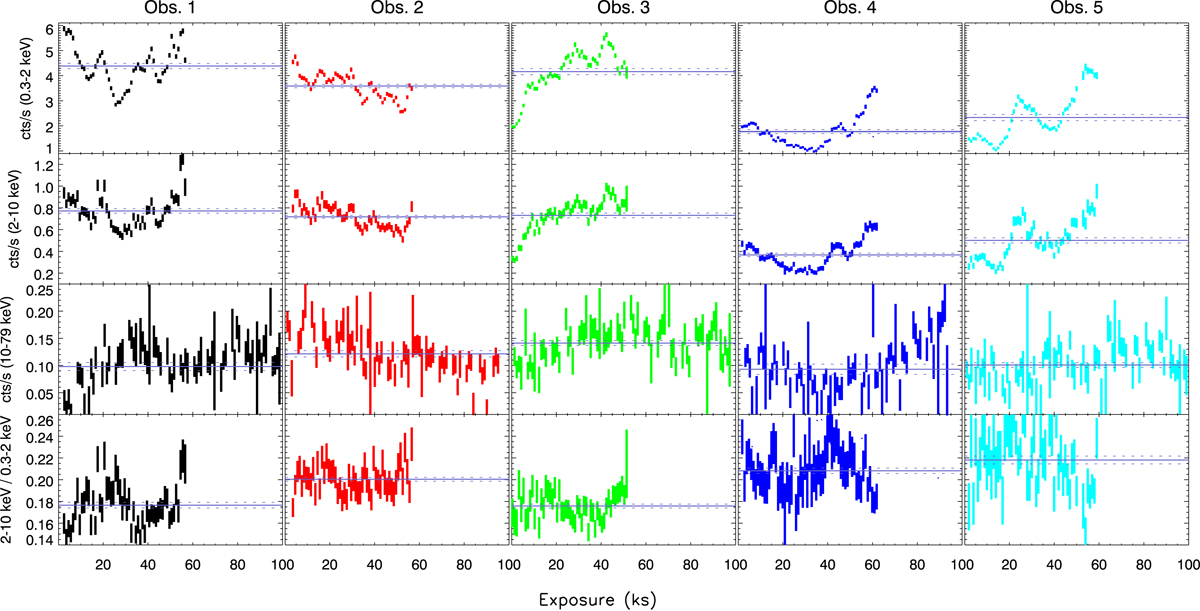
XMM-Newton light curves (background subtracted) in the 0.3–2 keV and 2–10 keV energy bands are shown in the top and top-middle panels, respectively. Bottom-middle panels: NuSTAR background subtracted light curves in the 10–79 keV band are reported, while the bottom row reports on the ratios between light curves in the 0.3–2 keV and 2–10 keV band. The adopted time binning is 1 ks for all the observations, and the solid violet lines account for the average rate of each observation, while dashed lines account for the standard error of the mean.
Current usage metrics show cumulative count of Article Views (full-text article views including HTML views, PDF and ePub downloads, according to the available data) and Abstracts Views on Vision4Press platform.
Data correspond to usage on the plateform after 2015. The current usage metrics is available 48-96 hours after online publication and is updated daily on week days.
Initial download of the metrics may take a while.