Fig. 2.
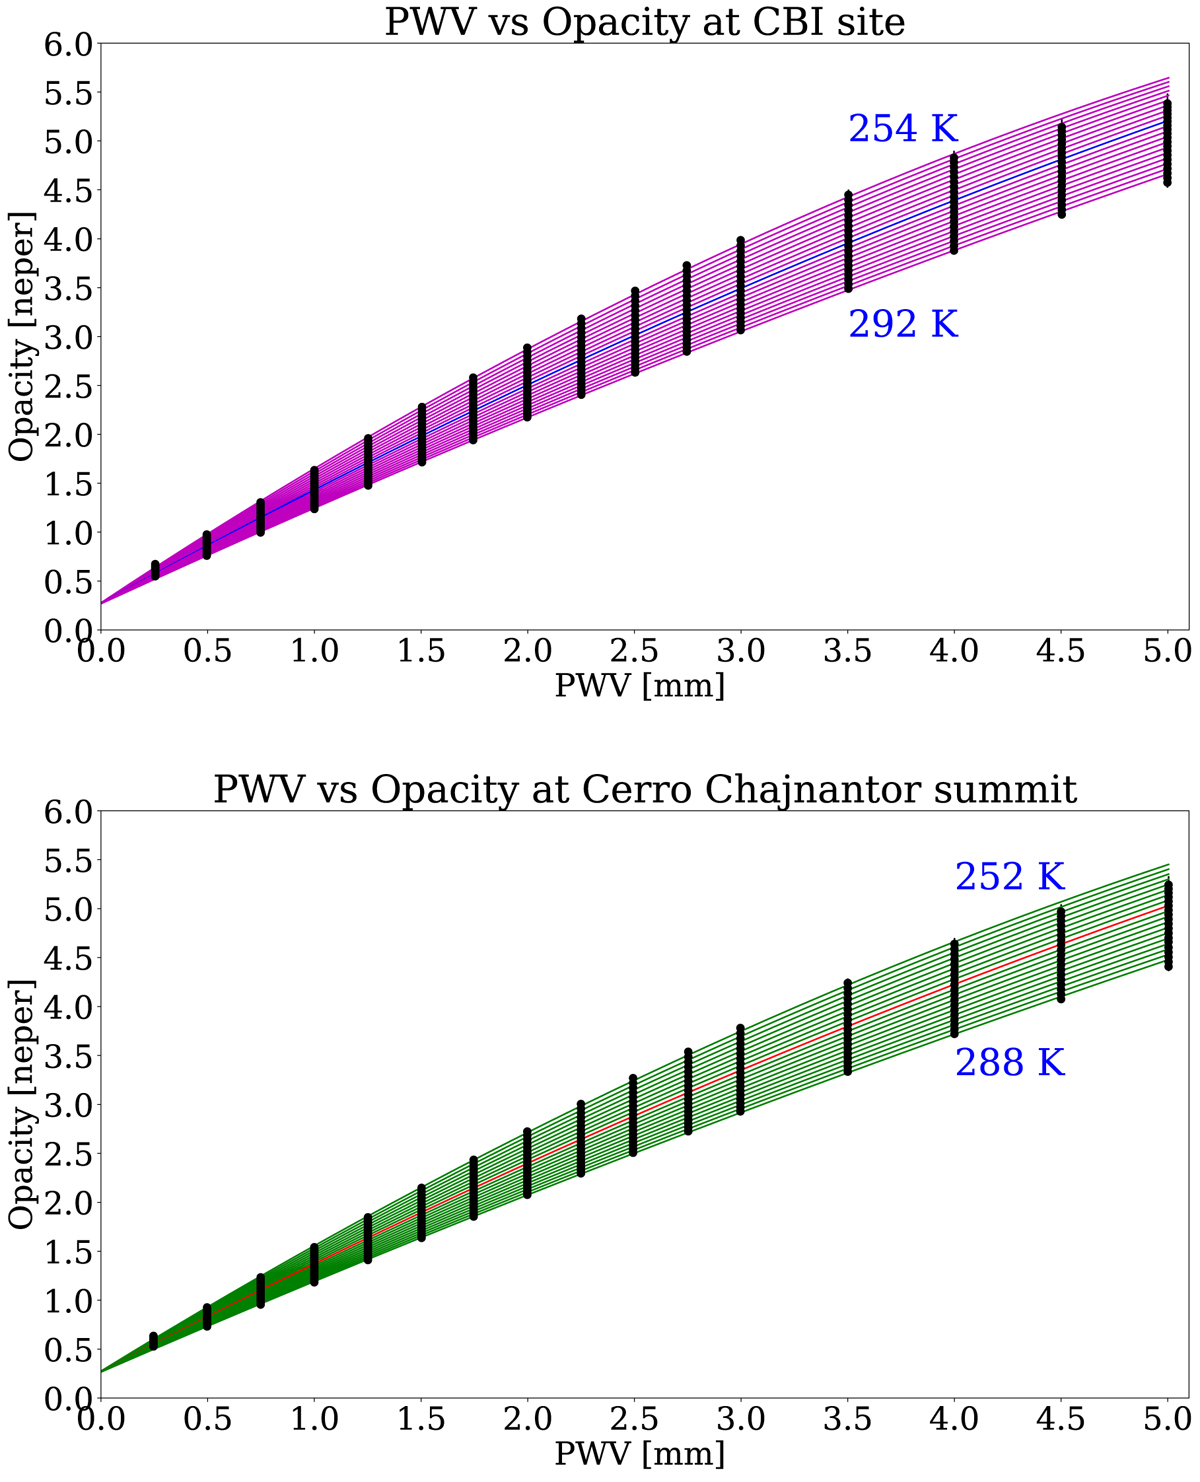
Tipper opacity simulations. The black dots indicate values extracted from the AM simulations. The lines correspond to weighted quadratic fits to the simulated data and for each Tgnd. Upper panel: situation for the Chajnantor Plateau, while lower panel: data and fits for the summit of Cerro Chajnantor. The blue (red) line in the middle of the distribution corresponds to the results for the average ground temperature at the plateau (Cerro Chajnantor) of 272.4 K (268.6 K), as previously used in Cortés et al. (2016).
Current usage metrics show cumulative count of Article Views (full-text article views including HTML views, PDF and ePub downloads, according to the available data) and Abstracts Views on Vision4Press platform.
Data correspond to usage on the plateform after 2015. The current usage metrics is available 48-96 hours after online publication and is updated daily on week days.
Initial download of the metrics may take a while.