Fig. 11.
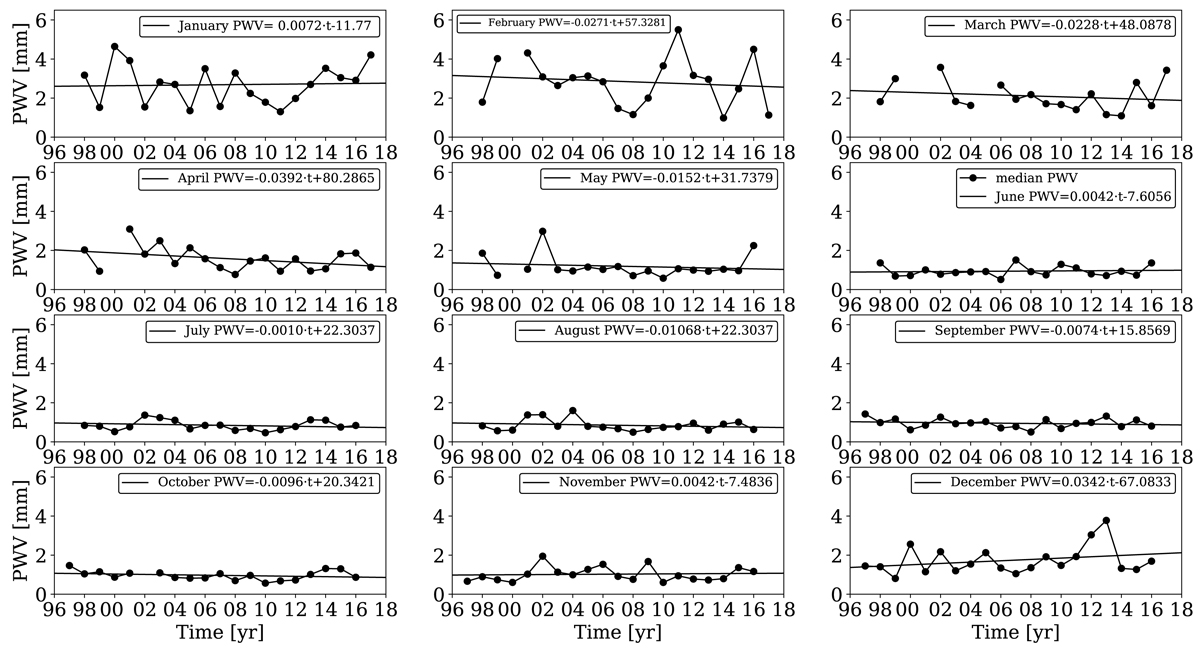
Median PWV per month over 1997–2017 in the Chajnantor Plateau. The dots indicate the median value of PWV in this year, while the straight line indicates the trend for the PWV over the period of the study, with a possibility of projecting future PWV values. The median for all the monthly slopes is −0.001 ± 0.014, that is, consistent with zero. We do not see a long-term increase or decrease in the atmospheric variable of interest for Chajnantor.
Current usage metrics show cumulative count of Article Views (full-text article views including HTML views, PDF and ePub downloads, according to the available data) and Abstracts Views on Vision4Press platform.
Data correspond to usage on the plateform after 2015. The current usage metrics is available 48-96 hours after online publication and is updated daily on week days.
Initial download of the metrics may take a while.