Fig. 10.
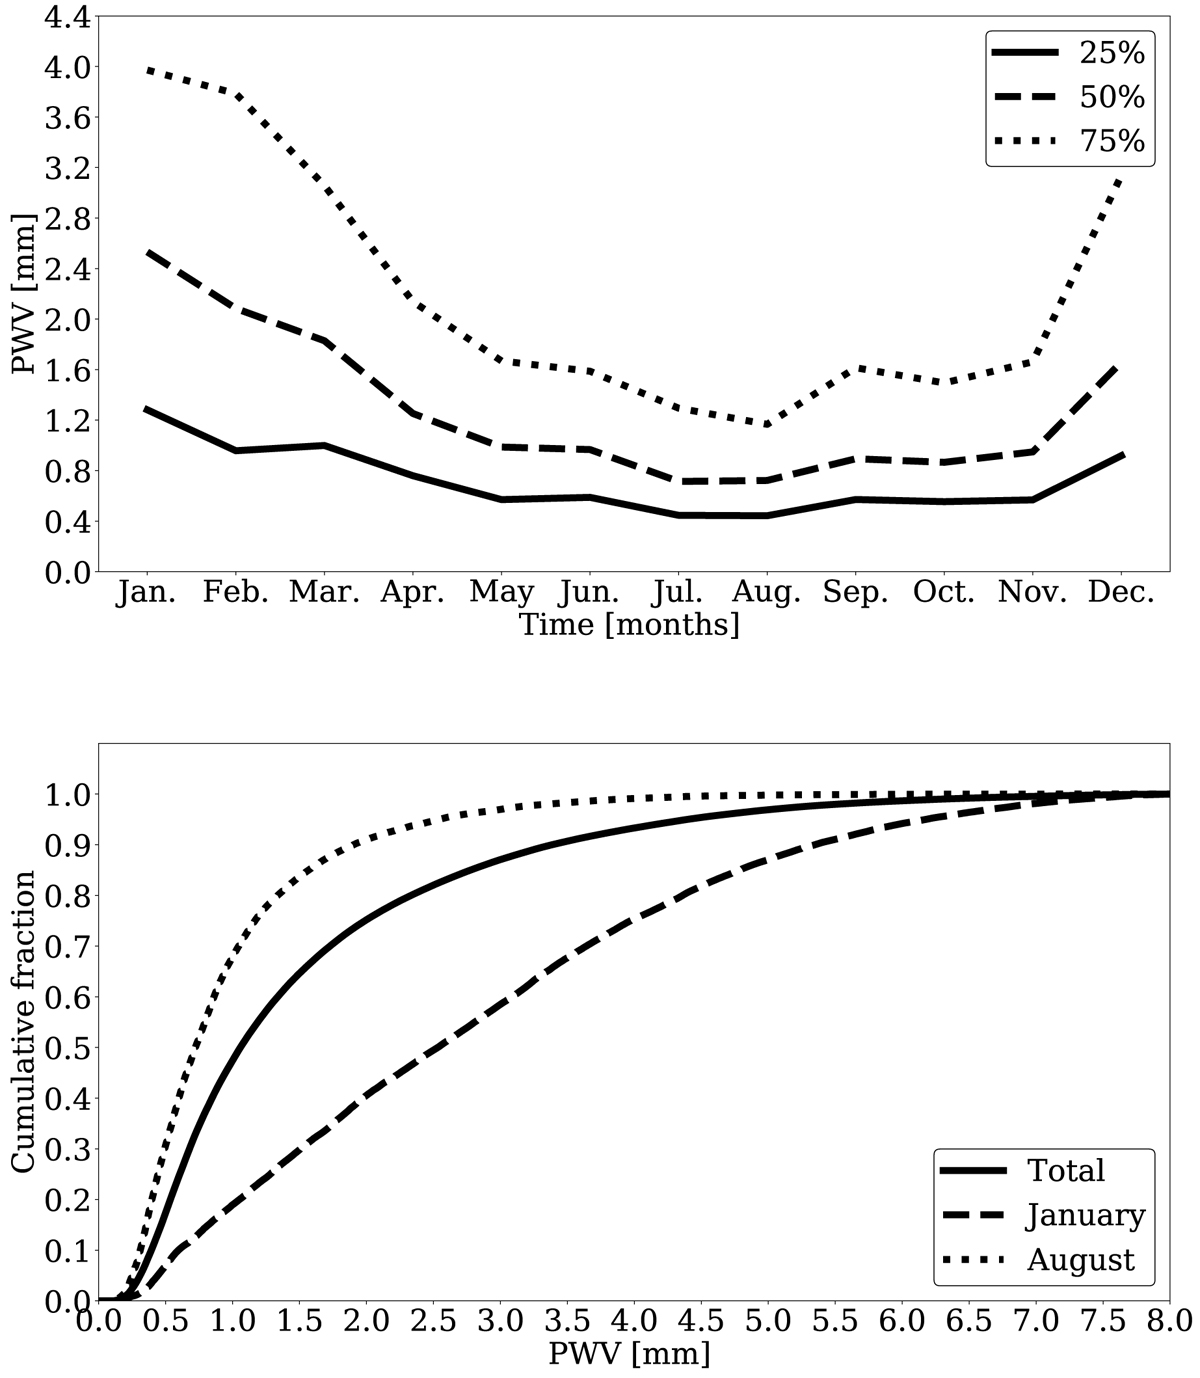
Twenty years of PWV study in Chajnantor Plateau. Monthly quartiles (25%, 50%, and 75%) of PWV measurements over the full period (upper panel). On the plateau, the best observing conditions are shown over June, July, and August. Cumulative distribution fraction of PWV for Chajnantor Plateau is shown in the lower panel. Total fraction, along with the extreme cases of January and August, are included to limit the typical range of PWV for the remaining months.
Current usage metrics show cumulative count of Article Views (full-text article views including HTML views, PDF and ePub downloads, according to the available data) and Abstracts Views on Vision4Press platform.
Data correspond to usage on the plateform after 2015. The current usage metrics is available 48-96 hours after online publication and is updated daily on week days.
Initial download of the metrics may take a while.