Fig. 7.
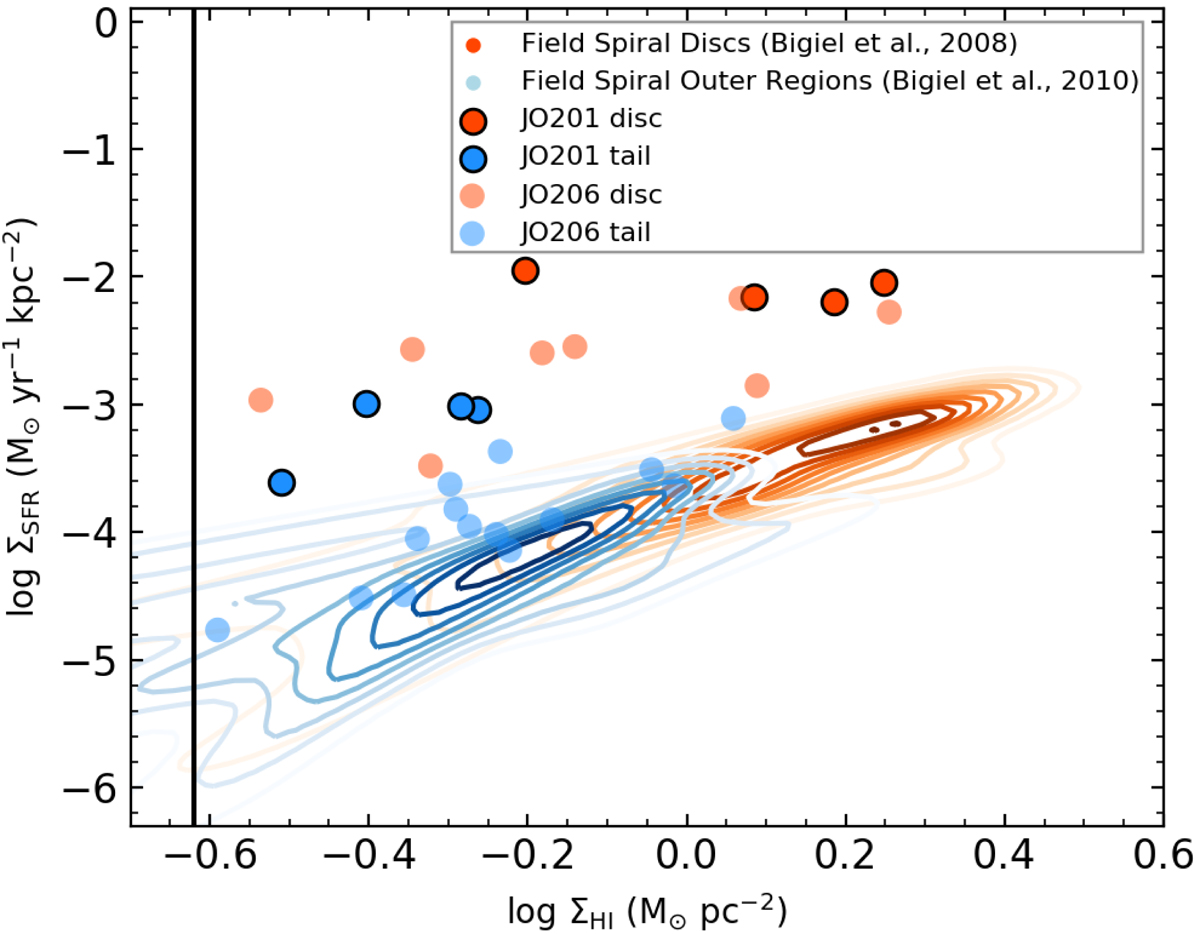
Relation between the star formation rate density and H I surface density. The red and blue points are the main galaxy body and tail of JO201, respectively. Corresponding pixels of the JO206 are plotted in the same colour but more transparent. The pixels are plotted independently per beam to avoid showing correlated pixel values in a beam. Orange density contours are the inner regions (discs) of field spiral galaxies selected from the THINGS sample from Bigiel et al. (2008) convolved with the H I beam. Light blue density contours represent the outer regions of spiral galaxies in the field (Bigiel et al. 2010) also convolved with the H I beam. The solid vertical line indicates our general H I sensitivity limit.
Current usage metrics show cumulative count of Article Views (full-text article views including HTML views, PDF and ePub downloads, according to the available data) and Abstracts Views on Vision4Press platform.
Data correspond to usage on the plateform after 2015. The current usage metrics is available 48-96 hours after online publication and is updated daily on week days.
Initial download of the metrics may take a while.