Fig. 3.
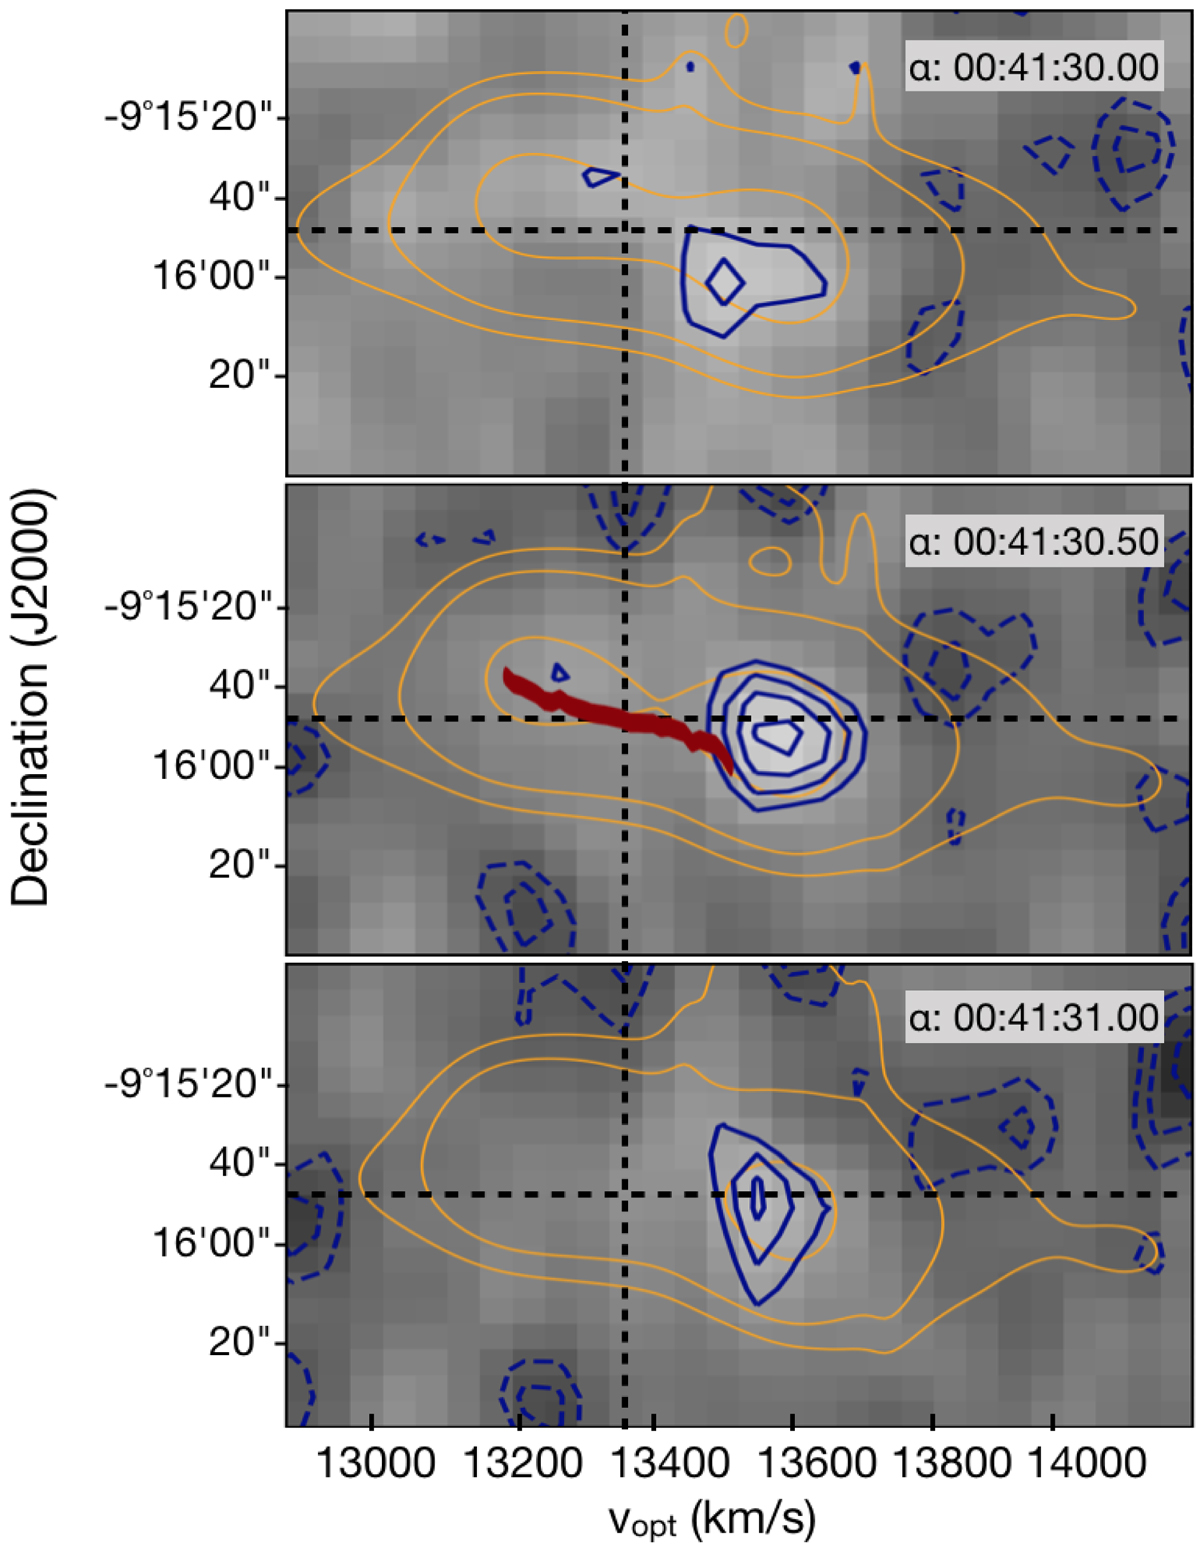
Position velocity diagrams (PVDs) extracted from the H I cube along the three 1.25′ wide right ascension slices indicated in the top right corner. The Hα emission convolved with the H I PSF is shown in orange. For reference, the red contour in the middle panel represents the stellar velocities extracted from Bellhouse et al. (2017) (no convolution to the HI angular resolution was performed). The Hα contours are drawn at surface brightness levels of 1 × 10n erg s−1 cm2 where n = −10, −9, −8 ⋯. The blue contours are the H I emission from the cube drawn at flux densities of 0.3, 0.4, 0.5 ... mJy beam−1 and the negative H I contours are drawn at −0.3, −0.2 ... mJy beam−1. The vertical dashed line is the systemic velocity of the galaxy and the horizontal line is the optical centre. Velocities in the PVDs are in the optical definition using the barycentric standard-of-rest.
Current usage metrics show cumulative count of Article Views (full-text article views including HTML views, PDF and ePub downloads, according to the available data) and Abstracts Views on Vision4Press platform.
Data correspond to usage on the plateform after 2015. The current usage metrics is available 48-96 hours after online publication and is updated daily on week days.
Initial download of the metrics may take a while.