Fig. 2.
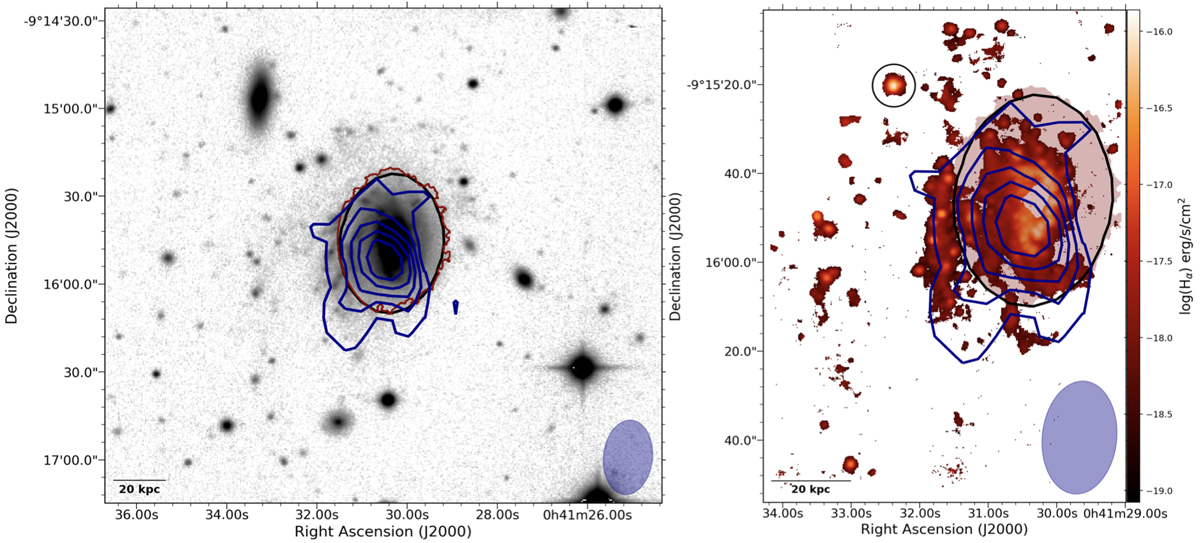
Left panel: VLA H I column density contours overlaid on the V-band image of JO201 from WINGS. Contour levels are drawn at column densities of 4, 8, 12, ... × 1019 atoms cm−2. The FWHM beam size of 16″ × 25″ is indicated by the blue ellipse. The red contours represent the stellar disc and the black contour is the H I disc (see text for a definition). Right panel: Hα emission with H I column density contours (same levels as the left panel) overlaid. The red opaque patch is the stellar disc and the black contour is the H I disc. The black circle is the region over which we estimate the H I flux density as described in the text.
Current usage metrics show cumulative count of Article Views (full-text article views including HTML views, PDF and ePub downloads, according to the available data) and Abstracts Views on Vision4Press platform.
Data correspond to usage on the plateform after 2015. The current usage metrics is available 48-96 hours after online publication and is updated daily on week days.
Initial download of the metrics may take a while.