Fig. A.1.
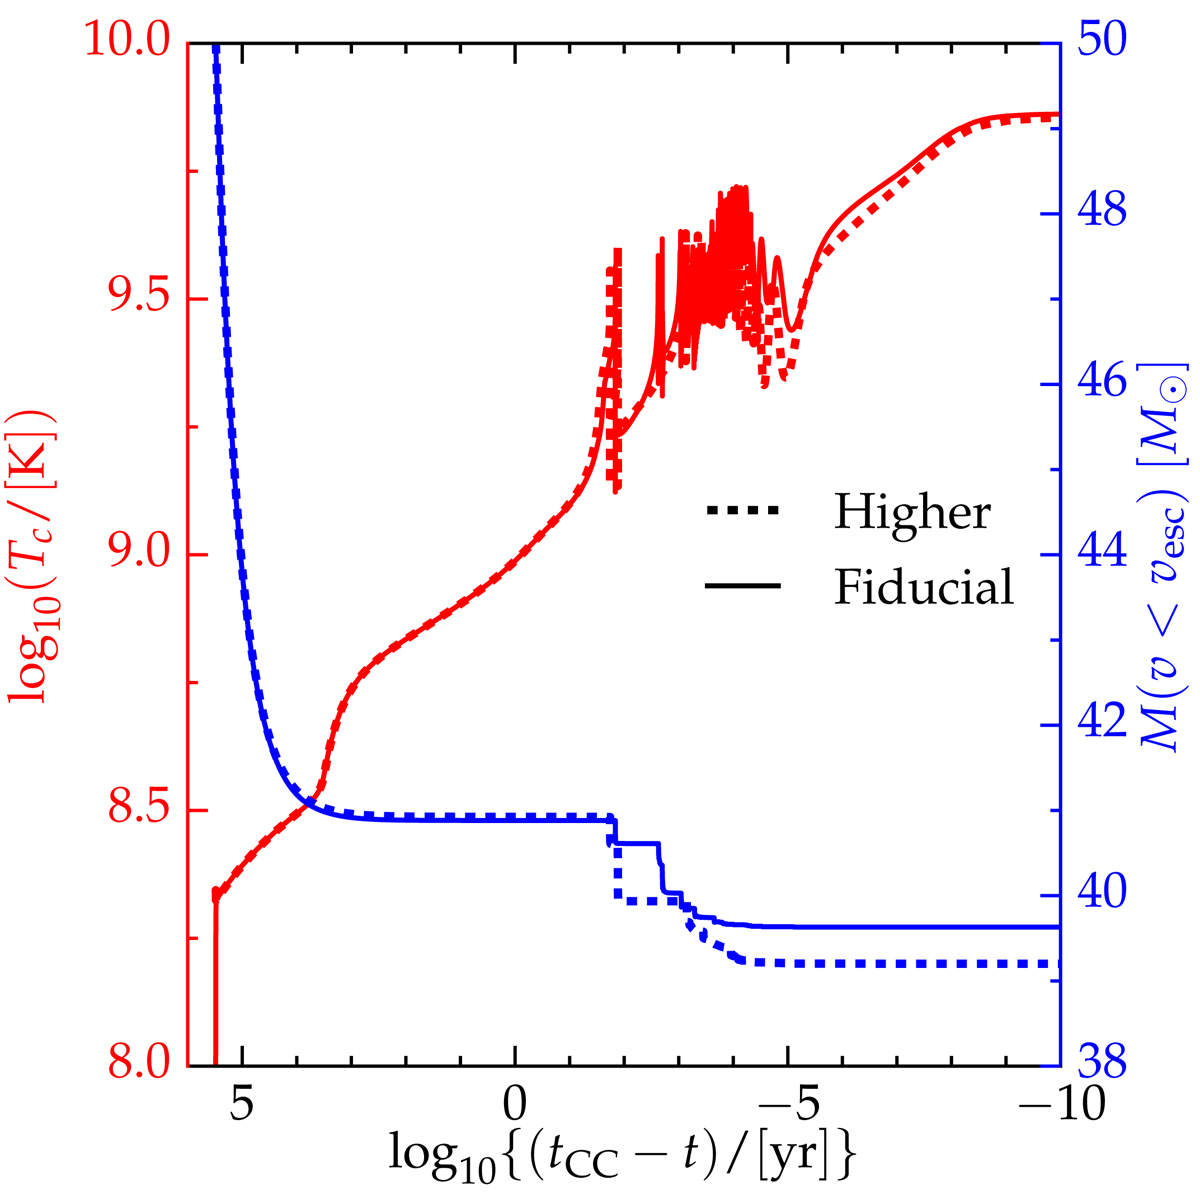
Mass (blue, right axis) and central temperature (red, left axis) evolution for our example 50 M⊙ example He core. The scale on the time axis emphasizes the short lived final phases. The differences in the final mass due to variations in the spatial and temporal mesh arise mostly from the dynamical phase of evolution and are limited to ΔM ≲ 0.5 M⊙.
Current usage metrics show cumulative count of Article Views (full-text article views including HTML views, PDF and ePub downloads, according to the available data) and Abstracts Views on Vision4Press platform.
Data correspond to usage on the plateform after 2015. The current usage metrics is available 48-96 hours after online publication and is updated daily on week days.
Initial download of the metrics may take a while.