Fig. 12.
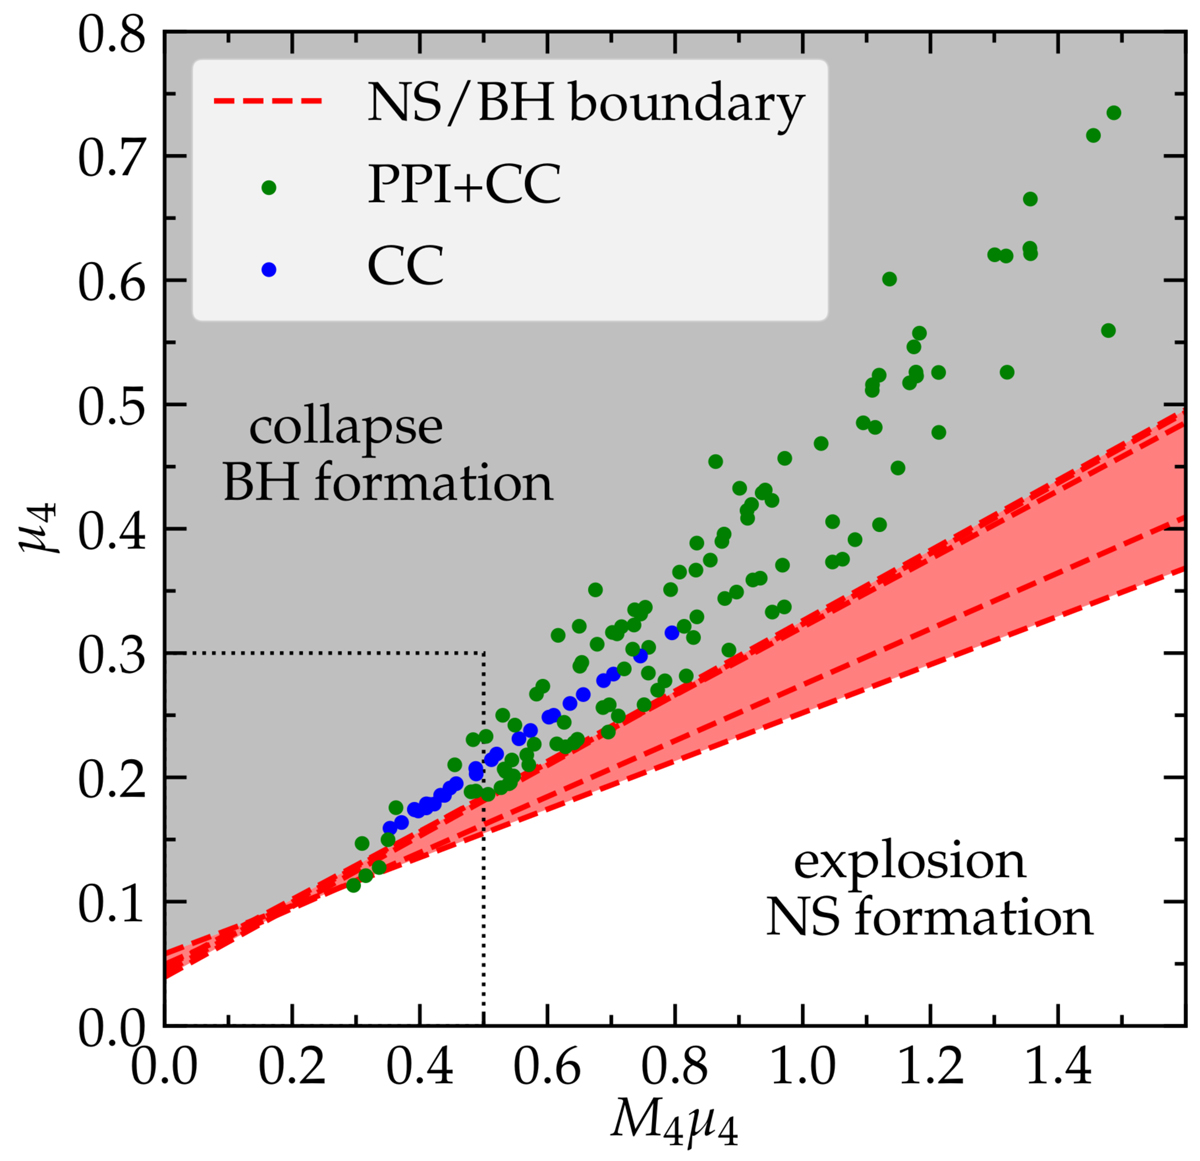
CC and PPI+CC models on the Ertl criterion plane for “explodability”. The red area indicates the uncertain boundary region between successful explosions and neutron star formation (white) and collapse with BH formation (gray). The dotted rectangle in the bottom left indicates the range originally showed in Ertl et al. (2016), most of our models require extrapolating outside this range. Blue dots correspond to CC models, while green dots show PPI+CC models.
Current usage metrics show cumulative count of Article Views (full-text article views including HTML views, PDF and ePub downloads, according to the available data) and Abstracts Views on Vision4Press platform.
Data correspond to usage on the plateform after 2015. The current usage metrics is available 48-96 hours after online publication and is updated daily on week days.
Initial download of the metrics may take a while.