Fig. 5.
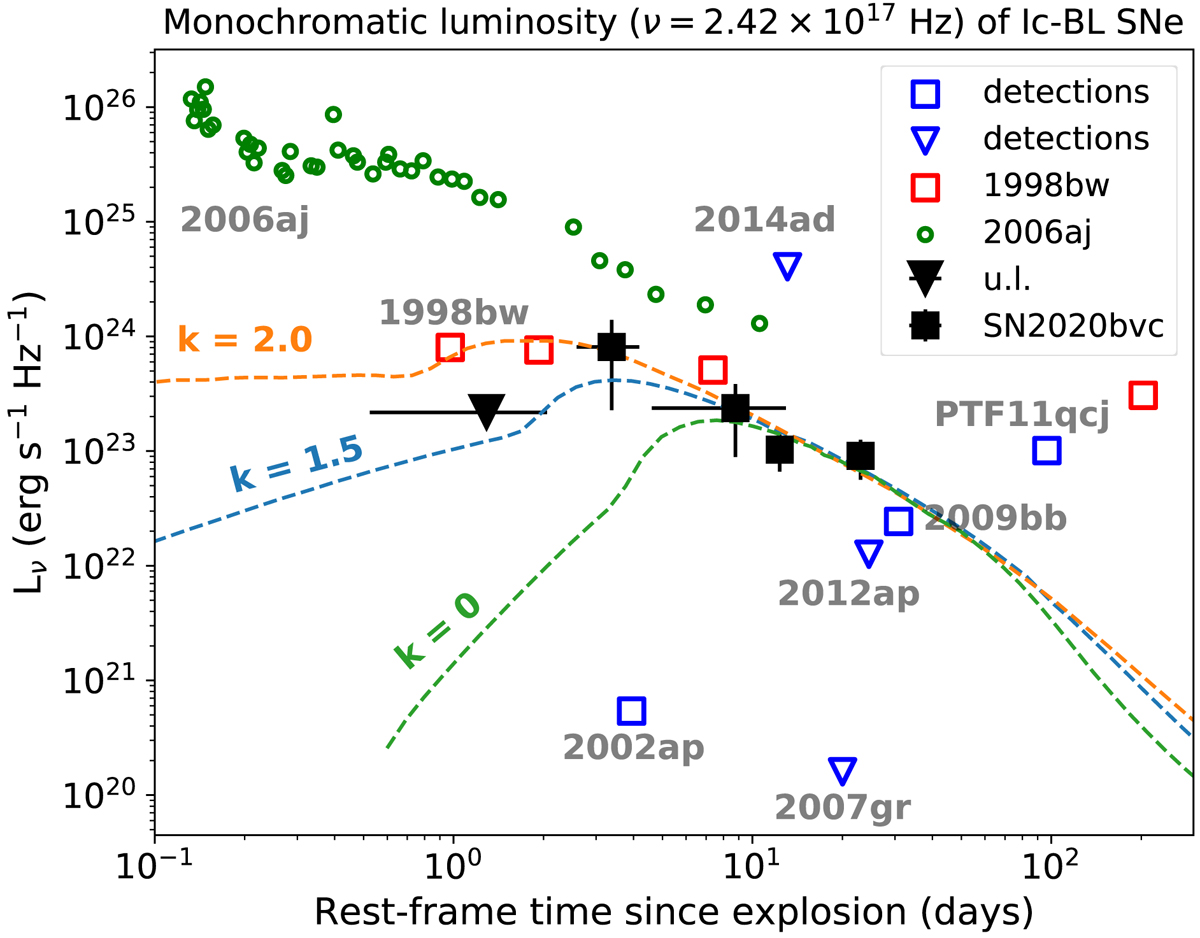
Monochromatic (ν = 2.42 × 10¹⁷ Hz) luminosity evolution of SN 2020bvc in the first 16 days. The dashed lines represent simulations of an off-axis (θ = 23 deg) X-ray afterglow characterized by a power-law circumburst density distribution ρ ∝ R−k, with index k = 2.0 (orange), k = 1.5 (blue), and k = 0 (green). The X-ray data and upper limits of SNe Ic-BL, including SN 1998bw associated with GRB 980425, reported with squares and triangles, respectively, are from Margutti et al. (2014) and have been corrected for the (0.1–10 keV) energy range, assuming a power-law spectral model with photon index γ = 2. Also shown are the light curve of SN 2006aj associated with GRB 060218 (Campana et al. 2006).
Current usage metrics show cumulative count of Article Views (full-text article views including HTML views, PDF and ePub downloads, according to the available data) and Abstracts Views on Vision4Press platform.
Data correspond to usage on the plateform after 2015. The current usage metrics is available 48-96 hours after online publication and is updated daily on week days.
Initial download of the metrics may take a while.