Fig. 4.
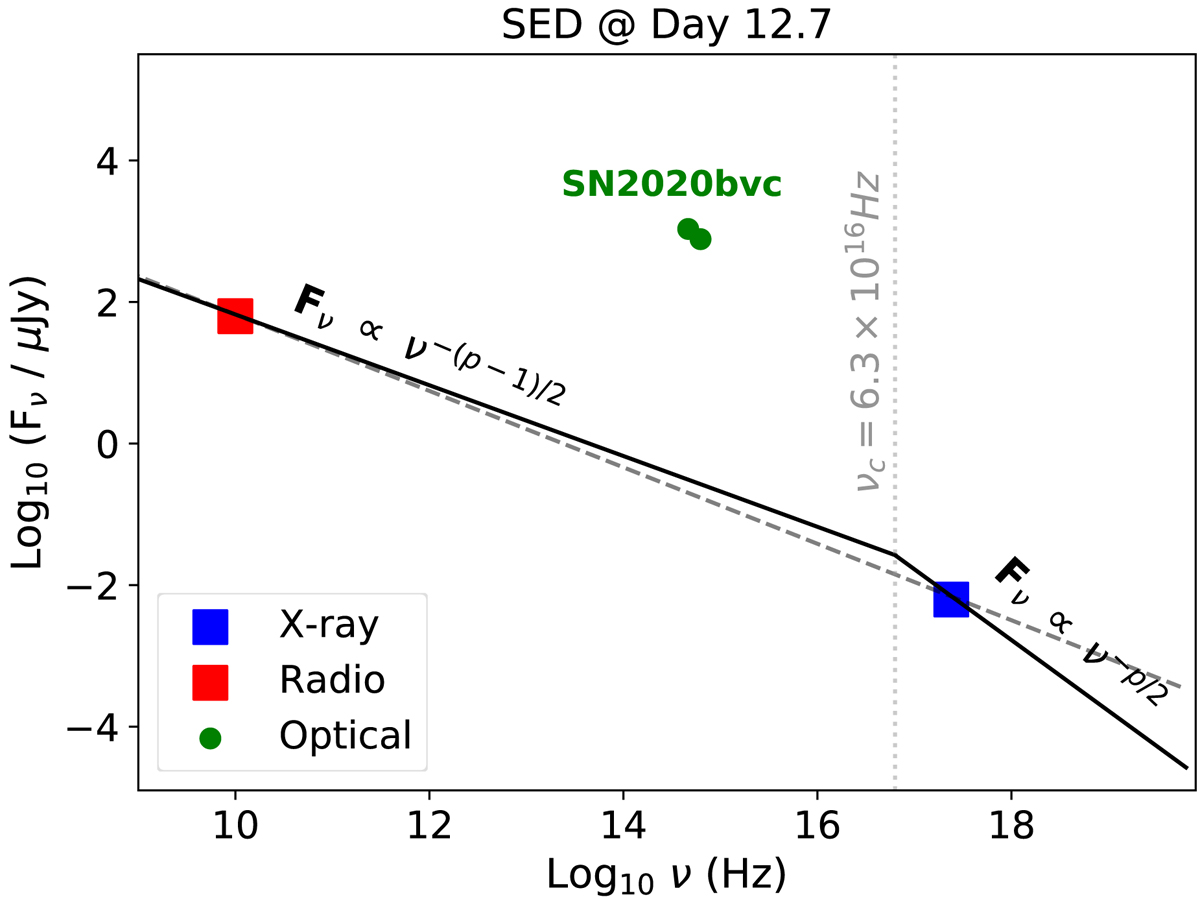
Multi-wavelength SED computed at Day 12.7 obtained using CXO data (blue data points: this paper) and the VLA radio observations (red data points: Ho et al. 2020c). We also included the ZTF g and r data points, computed for the same epoch from interpolation of the ZTF light curve. X-ray and radio data are clearly explained within the slow-cooling afterglow scenario (black line) (Sari et al. 1998; Granot et al. 2002), with a cooling-break frequency at νc = 6.3 × 10¹⁶ Hz. The dashed gray line shows the fit results using a single power-law segment with p = 2.08. The optical data are well above the afterglow model due to the presence of the bright SN 2020bvc.
Current usage metrics show cumulative count of Article Views (full-text article views including HTML views, PDF and ePub downloads, according to the available data) and Abstracts Views on Vision4Press platform.
Data correspond to usage on the plateform after 2015. The current usage metrics is available 48-96 hours after online publication and is updated daily on week days.
Initial download of the metrics may take a while.