Fig. 2.
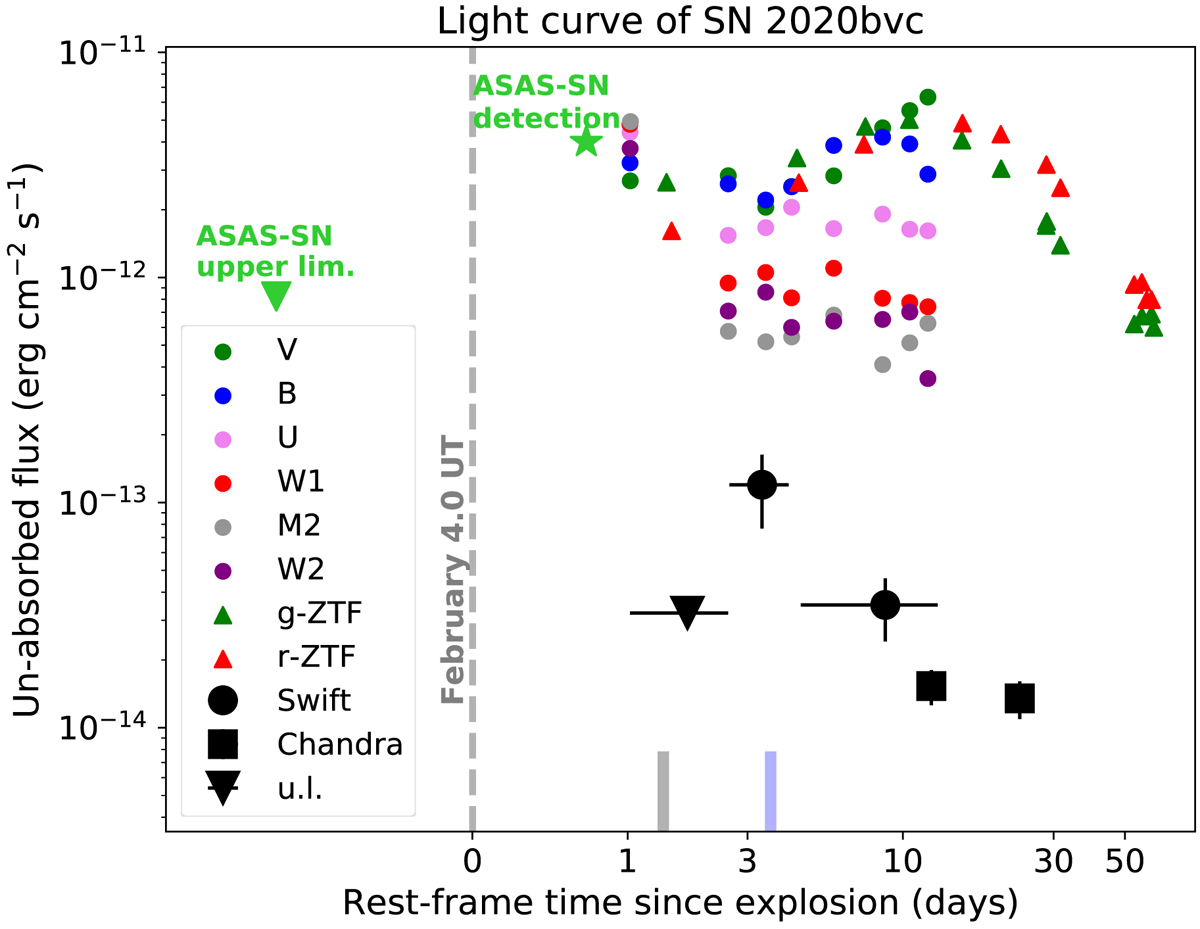
Optical and X-ray light curve of SN 2020bvc. X-ray (Swift-XRT and CXO, 0.3–10 keV) data are plotted in black, while Swift-UVOT data are represented with colored circles (Table C.1). Zwicky Transient Facility (ZTF, Graham et al. 2019; Bellm et al. 2019) g and r data (Table C.2) are shown as triangles. We also indicate the detection and the last non-detection by the ASAS-SN survey. Time is relative to the estimated epoch of SN explosion (see Sect. 4), shown with a gray dashed line. The epochs of the FLOYDS and SPRAT spectra are shown in gray and blue.
Current usage metrics show cumulative count of Article Views (full-text article views including HTML views, PDF and ePub downloads, according to the available data) and Abstracts Views on Vision4Press platform.
Data correspond to usage on the plateform after 2015. The current usage metrics is available 48-96 hours after online publication and is updated daily on week days.
Initial download of the metrics may take a while.