| Issue |
A&A
Volume 639, July 2020
|
|
|---|---|---|
| Article Number | A60 | |
| Number of page(s) | 6 | |
| Section | Planets and planetary systems | |
| DOI | https://doi.org/10.1051/0004-6361/202038147 | |
| Published online | 08 July 2020 | |
CO+ first-negative band emission: A tracer for CO in the Martian upper atmosphere
Physical Research Laboratory,
Ahmedabad
380009,
India
e-mail: This email address is being protected from spambots. You need JavaScript enabled to view it.
Received:
10
April
2020
Accepted:
19
May
2020
Abstract
Context. Recently, the Imaging Ultraviolet Spectrograph (IUVS) on board the Mars Atmosphere and Volatile EvolutioN (MAVEN) satellite observed CO+ first-negative band limb emission in the Martian upper atmosphere.
Aims. We aim to explore the photochemical processes in the Martian upper atmosphere, which drive this band emission.
Methods. A photochemical model was developed to study the excitation processes of CO+ first-negative band emission (B2Σ+ → X2Σ+) in the upper atmosphere of Mars. The number density profiles of CO2 and CO from two different models, namely, Mars Climate Database (MCD) and Mars Global Ionosphere-Thermosphere (MGIT), were used to determine the limb intensity of this band emission.
Results. By increasing the CO density by a factor of 4 and 8 in MCD and MGIT models, respectively, the modelled CO+ first-negative band limb intensity profile is found to be consistent with the IUVS/MAVEN observation. In this case, the intensity of this band emission is significantly determined by the ionisation of CO by solar photons and photoelectrons, and the role of dissociative ionisation of CO2 is negligible.
Conclusions. Since CO is the major source of the CO+(B2Σ+), we suggest that the observed CO+ first-negative band emission intensity can be used to retrieve the CO density in the Martian upper atmosphere for the altitudes above 150 km.
Key words: molecular processes / planets and satellites: atmospheres / planets and satellites: composition
© ESO 2020
1 Introduction
Aeronomical emissions of various excited species have been used as potential tools to study the composition of the Martian upper atmosphere (Barth et al. 1971; Strickland et al. 1972; Bertaux et al. 2005; Leblanc et al. 2006; Cox et al. 2010; Simon et al. 2009; Stiepen et al. 2015; Evans et al. 2015; Jain et al. 2015; Stevens et al. 2019; Deighan et al. 2018; Ritter et al. 2019; Gkouvelis et al. 2020; Jain et al. 2020; Qin 2020). In addition to the emissions of several atomic and molecular species, the emissions from the ionic species, such as CO (Fox-Duffendack-Barker band and ultraviolet doublet), N
 (Meinel and first-negative bands), and CO+ (first-negative and comet tail bands), are also important emission features in the ultraviolet spectra. The band heads of the CO+ first-negative system nearly occur at the same wavelengths as those of CO Cameron band emission. This makes them challenging to observe in the Martian ultraviolet spectra. Barth et al. (1971) have reported the observation of CO+ first-negative band emission (B1Σ → X2Σ+) in Mars during Mariner 6 and 7 experiments. However, the detection of this band emission in the Mariner 6 and 7 ultraviolet spectra is not straightforward. After subtracting the observed Martian ultraviolet spectra with the identified CO Cameron bands, the residual spectral features are ascribed to CO+ first-negative band emissions. By constructing the synthetic spectra, Conway (1981) noticed that this band emission was absent in the Mariner 9 observation. Recently, by analysing the Imaging Ultraviolet Spectrograph (IUVS) on board the Mars Atmosphere and Volatile EvolutioN (MAVEN) satellite (IUVS/MAVEN) observations from 6–8 April 2016, Stevens et al. (2019) have reported the first ever CO+ first-negative band emission in the upper atmosphere of Mars.
The photochemical processes of the principal emissions of the Martian upper atmosphere have been studied in several works by accounting for the various formation and loss mechanisms of different excited atmospheric species, (Fox & Dalgarno 1979; Mantas & Hanson 1979; Conway 1981; Shematovich et al. 2008; Simon et al. 2009; Gronoff et al. 2012a,b; Jain & Bhardwaj 2012, 2011; Gkouvelis et al. 2018; Gérard et al. 2019; Ritter et al. 2019). Photoionisation of CO, photoelectron impact ionisation of CO, photodissociative ionisation of CO2, electron impact dissociative ionisation of CO2, and resonance fluorescence of CO+ are the excitation sources of CO+ in the B2Σ+ state. By assuming different photon and electron impact cross sections of CO and CO2, Conway (1981) estimated that photodissociative ionisation of CO2 is the majorsource of this band emission in the Martian upper atmosphere. In light of the recent IUVS/MAVEN observation of CO+ first-negative band emissions, we have developed a photochemical model to study the emission processes of the CO+ first-negative band in the Martian upper atmosphere. The main aim of the present work is to study the contribution of different excitation processes which produce CO+ first-negative band emission during the IUVS/MAVEN observation. By considering different atmosphericneutral density profiles in the model, we determine the volume emission rates of CO+ (B2Σ+) and the limbintensity profiles of CO+ first-negative band emission for various excitation mechanisms. We also compare our modelled limb intensity profiles with the IUVS/MAVEN observation.
2 Model inputs and calculations
During the IUVS/MAVEN observation period, that is, from 6–8 April 2016, the Neutral Gas and Ion Mass Spectrometer (NGIMS) onboard MAVEN was also measuring the neutral density profiles of major species. But the NGIMS measurements of the major neutral densities are limited up to the MAVEN periapsis altitude of about 160 km. Since the peak intensity of the CO+ first-negative emission is limited down to the altitude of 160 km, we used the primary neutral densities (CO2, CO, N2, O2, and O) from the Mars Climate Database (MCD; version 5.3, González-Galindo et al. 2015) and Mars Global Ionosphere-Thermosphere (MGIT; Bougher et al. 2015) models for the IUVS/MAVEN observation conditions. To compare the MCD and MGIT modelled CO2 neutral density with in-situ measurements, we analysed the NGIMS/MAVEN level 2 (L2), version 8, revision 1 data from 6–8 April 2016 for the altitudes above 160 km1. More details of the L2 data product are available in Benna & Elrod (2018). The NGIMS/MAVEN measured neutral number densities are interpolated over a uniform grid of 1 km from the periapsis altitude, that is, 155–230 km for all the orbital profiles observed from 6–8 April 2016. Figure 1 shows the CO2 and CO neutral density profiles obtained from the two models. In this figure, MGIT and MCD modelled CO2 densities are also compared with the NGIMS/MAVEN in-situ measurements.
Solar radiation flux, which is the primary energy source of the Martian upper atmosphere, is taken from the measured daily-average value in the wavelength region of 5–1900 Å on 7 April 2016 for orbit #2960 from the Solar Extreme Ultraviolet Monitor (EUVM) instrument onboard MAVEN (Eparvier et al. 2015; Thiemann et al. 2017). A part of this solar flux spectrum is plotted in Fig. 2. The photoabsorption and photoionisation cross sections of the primary gases are taken from Huebner et al. (1992)2. The branching ratios for different excited states of CO , CO+, N
 , O+, and O
 ions are taken from Avakyan et al. (1998). The photoionisation and dissociative photoionisation excitation cross sections of CO and CO2 producing CO+ (B2Σ+) are taken from Plummer et al. (1977) and Wu & Judge (1986), respectively. These cross sections are also plotted in Fig. 2. The electron impact cross sections of CO2 and CO producing CO+ (B2Σ+) are obtainedfrom Ajello (1971) and Arqueros & Campos (1981), respectively. These cross sections are presented in Fig. 3. The branching ratio for CO+ (B2Σ+) that leads to (0–0) electronic transition is taken as 0.305 (Arqueros & Campos 1982). Under a photochemical equilibrium condition, the densities of major (O
 and NO+) and minor (CO
 , CO+, N
 , O+, and C+) ions are also calculated by accounting for the important production and loss mechanisms. Resonance fluorescence of CO+ producing first-negative band emission was incorporated in the model by multiplying the modelled CO+ ion density with an emission rate (g-factor) of 5.2 × 10⁻⁵ s−1 (Barth 1969). Scholl et al. (1998) experimentally determined the radiative lifetime of B2 Σ+ excited state as about 55 ns. Due to the short radiative lifetime, the collisional quenching of this excited state can be neglected. A fractional population of this excited state can decay to the ground state via A2 Πu, which leads to comet-tail band emission. Lawrence (1965) determined that about 10% of CO+ (B2Σ+) ions decay to the A2Πu state and the rest directly decay to the ground state. Hence, we consider that 90% of the modelled volume emission rate leads to CO+ first-negative band emission.
The modelled suprathermal electron flux in the Martian upper atmosphere at an altitude of 130 km is presented in Fig. 3. A detailed explanation for the calculation of steady-state suprathermal electron flux and limb emission intensities in the Martian upper atmosphere is given in our earlier works (Jain & Bhardwaj 2011, 2012). Here, we briefly describe the calculation of suprathermal electron flux spectra. Solar radiation is degraded using Beer-Lambert’s law in the Martian upper atmosphere and the primary photoelectron production rate spectrum Q(Z, E), at a given altitude Zas a function of energy E, is calculated using the following equation:
 (1)
(1)
![Mathematical equation: \begin{equation*} I(Z,\lambda) = I(\infty, \lambda) \textrm{exp}\left[-\textrm{sec}(\chi) \sum_l \sigma_l^A(\lambda) \int_{Z}^{\infty} n(Z') \textrm{d}Z' \right] ,\end{equation*}](/articles/aa/full_html/2020/07/aa38147-20/aa38147-20-eq10.png) (2)
(2)
where  and
and  are the total photoabsorption and photoionisation cross sections of jth ion of the lth atmospheric species at wavelength λ, respectively. We note that I(∞, λ) is the unattenuated solar flux at wavelength λ at the top of the atmosphere; nl(Z) is the number density of lth species at altitude Z; χ is the solar zenith angle (SZA); δ(hc/λ - E - Wjl) is the delta function, in which hc/λ is the energy of incident photon; Wjl is the ionisation threshold of jth ionic state of the lth species; and E is the energy of ejected electron. We calculated the steady state photoelectron flux ϕ(Z, E) at altitude Z and at energy E using Analytical Yield Spectrum (AYS) method using the following equation:
 (3)
(3)
where σlT(E) is total inelastic cross section of lth species and U(E, E0) is the two-dimensional AYS, which contains the non-spatial electron degradation information. More details about the AYS method can be found in our earlier work (Singhal & Haider 1984; Bhardwaj et al. 1990, 1996; Bhardwaj 1999; Jain & Bhardwaj 2011, 2012; Bhardwaj & Jain 2013; Raghuram & Bhardwaj 2012, 2013).
We determined the volume emission rate profiles of CO+(B2Σ+) for different electron and photon induced processes using the modelled photon and suprathermal electron fluxes as well as the corresponding cross sections. These modelled volume emission rate profiles were integrated along the IUVS/MAVEN tangential line of sight and converted into brightness in Rayleigh (1 Rayleigh = 106 /4π photons cm−2 sec−1 sr−1) using the following equation:
 (4)
(4)
Here, r is the abscissa along the horizontal line of sight and V(r) is the volume emission rate (photons cm−3 s−1) at a particular emission point r on the tangent. The factor of 2 in multiplication is due to the symmetry along the line of sight concerning the tangent point. This factor is necessary when the volume emission rate is integrated from the tangent point to infinity. The absorption of CO+ first-negative band emission by other Martian species along the line of sight is negligible due to the low photoabsorption cross section.
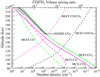 |
Fig. 1 Number density profiles of CO2 and CO from MCD and MGIT models. Solid and dash-dotted curves represent CO2 and CO density profiles, respectively. The grey shaded area represents the variation in the NGIMS/MAVEN measured CO2 density from 6–8 April 2016 for the orbits #2953–2962. The solid black curve in the shaded area represents the averaged value of CO2 from the NGIMS/MAVEN measurements. The calculated CO/CO2 volume mixing ratio profiles are plotted with dashed curves with a scale on top of the x-axis. |
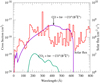 |
Fig. 2 Photoionisation cross sections of CO2 and CO producing CO+(B2Σ+), which are taken from Wu & Judge (1986) and Plummer et al. (1977), respectively. The cross section of Wu & Judge (1986) is linearly extrapolated for the wavelength below 180 Å. The daily-averaged solar flux for the wavelengths below 800 Å, which was obtained from the measurements of the Solar Extreme Ultraviolet Monitor instrument onboard MAVEN on 7 April 2016 for the orbit #2960 (Eparvier et al. 2015), is plotted with a scale on the right y-axis. |
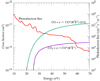 |
Fig. 3 Electron impact ionisation cross sections of CO2 and CO producing CO+(B2Σ+) which are taken from Ajello (1971) and Arqueros & Campos (1981), respectively. Modelled steady state suprathermal electron flux (red solid curve) at an altitude of 130 km using MCD neutral density profile and for SZA of 75° is plotted with a scale on the right y-axis. |
3 Results and discussion
The left and right panels of Fig. 4 show the modelled volume emission rate profiles of CO+(B2Σ+) via different excitation mechanisms using the neutral density profiles from MCD and MGIT models, respectively, for the IUVS/MAVEN observational conditions at SZA of 75°. These calculations show that the peak formation rate of CO+(B2Σ+) occurs at analtitude of around 140 km. By using the neutral densities from the MCD model, the total volume emission rate of CO+(B2Σ+) is significantly controlled by photoionisation of CO and the contribution from photon and electron impact dissociative ionisation processes of CO2 is less than 30% of the total (see the left panel of Fig. 4). When we use the neutral density profiles from the MGIT model, about 80% of the total peak volume emission rate of CO+(B2Σ+) is controlled by dissociative ionisation of CO2, whereas photoionisation of CO is the important production source for the altitudes above 170 km (see the right panel of Fig. 4).
It can be noticed in Fig. 1 that the CO2 (CO) density profile of the MGIT model is higher (lower) by about a factor of 3 (5) compared to that of the MCD model. Hence, the differences in neutral densities of MCD and MGIT models lead to the photoionisation of CO and the photodissociative ionisation of CO2 to each be respective major excitation sources of CO+(B2Σ+) at an altitude of around 140 km (see Fig. 4). Moreover, the difference in photon and electron impact cross sections of CO and CO2 also plays an important role in determining the volume emission rate, which is discussed later. The contribution from solar resonance fluorescence of CO+ is smaller by about an order of magnitude or more than the total volume emission rate in both the modelled profiles.
Figure 5 shows a comparison between the modelled limb intensities for different excitation mechanisms, which are determined using neutral densities from MCD (left panel) and MGIT (right panel) models as well as the IUVS/MAVEN observation. Using the neutral density profiles from the MCD model, the modelled total limb intensity profile is only consistent with the lower limit of the IUVS/MAVEN observation at a few altitudes (see the left panel of Fig. 5). In this case, photon and photoelectron impact ionisation processes of CO are the significant production sources to the total CO+ first-negative band emission intensity. As is shown in Fig. 1, the CO2 neutral density profile is smaller by a factor of 3 compared to the averaged value of the NGIMS/MAVEN in-situ measured density for the altitudes above 160 km. To assess the role of CO2 on the modelled limb intensity, we increased its neutral density profile by a factor of 3. By increasing the MCD modelled CO2 density profile, the calculated total limb intensity profile is not consistent with the IUVS/MAVEN observed average intensity. However, when the CO neutral density profile is increased by a factor of 3 (hereafter Case-A), the modelled limb intensity profile is in agreement with IUVS/MAVEN observation. These calculations suggest that CO density plays a significant role compared to that of CO2 in explaining the IUVS/MAVEN observed CO+ first-negative band emission profile.
By using the neutral densities from the MGIT model, the modelled total limb intensity is smaller by a factor of 3 or more compared to the average intensity profile of theIUVS/MAVEN observation (see the right panel of Fig. 5). In this case, below 140 km altitude, photon and electron impact dissociative ionisation processes of CO2 are the significant sources of CO+ first-negative band emission. Above 160 km radial distance, the contribution from CO is important for the total emission intensity. Since the CO2 neutral density of the MGIT model is consistent with NGIMS/MAVEN in-situ measurements (see Fig. 1), we assess the impact of CO density on the modelled limb emission intensity. By increasing the MGIT CO neutral density profile by a factor of 8 (hereafter Case-B), the modelled limb intensity is found to be in agreement with the IUVS/MAVEN observation. This calculation also suggests that a higher amount of CO is required to explain the IUVS/MAVEN observed emission profile. By considering the variability in CO2 density as measured by NGIMS/MAVEN (a factor of 2–5, as shown in Fig. 1), no agreement was found between the modelled limb intensity profile for the dissociative ionisation of CO2 and the IUVS/MAVEN observation, which also suggests that CO2 is not a suitable candidate to explain the observed CO+ first-negative band emission. For all of the above cases, the contribution from solar resonance is very small (<1 R), hence it is not shown in Fig. 5.
We also explored the role of thermosphere temperature, which determines the scale heights of CO2 and CO densities during the IUVS/MAVEN observation period. By analysing the NGIMS and IUVS measurements, Bougher et al. (2017) have studied the structure and variability of the Martian dayside thermosphere during the MAVEN observation period, that is, October 2014 to May 2016. This analysis shows that the mean temperature of the Martian upper atmosphere, during the period from 22 March 2016 to 10 April 2016 for the orbits #2873–2974, was around 195 K with a variability of 155–225 K (see Fig. 2 of Bougher et al. 2017). IUVS/MAVEN observed the CO+ first-negative band emission on 7 April 2016 for the orbits #2953–2962 (Stevens et al. 2019), and during this period the derived mean temperature of the thermosphere from the MAVEN observations was below 225 K. Moreover, as is shown in Fig. 1, the variation in CO2 neutral density that NGIMS/MAVEN measured is also small (by a factor ~2 to 5). Thus, during the IUVS/MAVEN observation period, the derived lower thermosphere temperature (<225 K), the lack of subst antial variability in the in-situ measured CO2 neutral density, and the lower contribution of dissociation excitation of CO2 (see Fig. 5) also confirm that the dissociative ionisation of CO2 cannot be a significant excitation source to explain the observed limb intensity profile.
The smaller value of photon and electron impact dissociative excitation cross sections of CO2 compared to that of CO is also another main reason for CO2 not being a potential source of CO+ first-negative band emission (see Figs. 2 and 3). Using the experimentally determined photoionisation cross sections and onboard measured solar flux, we calculated the unattenuated photoionisation excitation frequencies of CO2 and CO, producing CO+(B2Σ+) as 5.5 × 10⁻¹⁰ and 1 × 10⁻⁸ s−1, respectively. Due to the large flux, the solar radiation at the wavelength He II 303 Å significantly determines these modelled photoionisation excitation frequencies (see Fig. 2). Our calculated photoionisation excitation frequencies show that the formation of CO+(B2Σ+) via the CO channel is 20 times more efficient. Hence, even though the number density is small, CO significantly controls the CO+(B2Σ+) formation and subsequently CO+ first-negative band emission intensity in the Martian upper atmosphere for the altitudes above 150 km. Moreover, due to the difference in scale heights, the CO2 neutral density decreases with altitude much faster than that of CO, which leads to a progressive decrease in the contribution from CO2 to the total CO+ first-negative band emission above the homopause (see Fig. 5).
In addition to the role of number densities, we also studied the impact of uncertainties associated with the measurement of photon and electron impact ionisation cross sections of CO and CO2 as well as the solar flux on the modelled limb intensity profiles. As mentioned earlier, the photon cross sections of CO and CO2 producing CO+(B2Σ+) are taken from Plummer et al. (1977) and Wu & Judge (1986), respectively. Wu & Judge (1986) did not mention the uncertainty in their measured photoionisation cross section of CO2. Even in increasing this cross section by a factor of 2, no agreement was found between the modelled limb intensity profile and the IUVS/MAVEN observation. For CO, Plummer et al. (1977) determined the photoionisation cross section of CO+(B2Σ+) using their experimentally measured branching ratios and total absorption cross section. Their results are also consistent with the earlier experimental determination by Samson et al. (1976) and van der Wiel & Brion (1972). Samson et al. (1976) determined that the statistical error in the measured branching ratios is less than 10%. Thus, the effect of uncertainty in the measured photoionisation cross section of CO has a small impact on the modelled limb emission intensities.
The uncertainties associated with the measured electron impact cross sections of CO2 and CO by Ajello (1971) and Arqueros & Campos (1981) are about 25%, respectively. However, it should be noted that the photoionisation excitation rates of CO2 and CO producing CO+(B2Σ+) are higher by a factor 2 or more compared to those of electron impact ionisation (see Fig. 4). Thus, the role of uncertainties in the measured electron impact cross sections on the modelled limb intensity profiles can be neglected. Regarding the uncertainty in the solar flux, Thiemann et al. (2017) find that about a maximum of 30% uncertainty is possible in the daily measured solar flux for the wavelengths less than 700 Å in the Flare Irradiance Spectral Model on Mars (FISM-M). Hence, for given CO and CO2 density profiles, we estimate that the uncertainties associated with the cross sections and the solar flux can lead to about a maximum of 40–50% uncertainty in the modelled limb intensity.
On 7 April 2016, IUVS measured CO+ first-negative band emission intensity with a standard deviation of one σ (Stevens et al. 2019). But it can be noticed in Fig. 5 that for the altitudes above 170 km, the observed CO+ first-negative band emission intensity varies significantly. In taking this variation into account, we varied the CO densities in the MCD and MGIT models to reconcile the IUVS/MAVEN observation. To explain the observed emission intensity profile, we find that the CO density profiles of the MGIT and MCD models should be increased by a factor of 6–10 and 3–5, respectively. This calculation suggests that during the IUVS observation period, the CO density may vary significantly along the IUVS/MAVEN line of sight. However, no NGIMS/MAVEN in-situ measured CO density profiles are available in order to study the variation in IUVS/MAVEN observed CO+ first-negative band intensity.
It is important to note that CO is an important minor species in the Martian upper atmosphere, which plays a significant role in maintaining the stability of CO2 via a photochemical cycle. The direct recombination of CO and O, which are dissociative products of CO2, is forbidden. Hence, this reaction cannot be an effective mechanism to recycle CO2 in the Martian upper atmosphere. By invoking heterogeneous chemistry, several modelling works were carried out to study the stability of CO2 in the Martian atmosphere (McElroy & Hunten 1970; McElroy et al. 1976; Nier & McElroy 1977; Krasnopolsky 1993; Nair et al. 1994; Atreya & Gu 1994, 1995). Since CO primarily originates from the photodissociation of CO2, the variation in CO2 density has a direct impact on the CO abundance. Moreover, the chemical loss reaction between OH and CO, which consequently recycle the CO2, also determines the concentration of CO in the Martian upper atmosphere (Nair et al. 1994; González-Galindo et al. 2005). As shown earlier, when we use a larger amount of CO than MCD and MGIT modelled values, the modelled limb intensity profile for Case-A and Case-B are in agreement with the IUVS/MAVEN observation (see Fig. 5). Since no strong variability in the NGIMS/MAVEN measured CO2 number density is seen (with a variation of a factor of 2 from the mean value, see Fig. 1) and as the derived thermosphere temperature is low (~200 K, see Bougher et al. 2015), the larger amount of CO density in the Martian upper atmosphere is only possible if its chemical loss rate is significantly low during the IUVS observation period. By analysing data from the Compact Reconnaissance Imaging Spectrometer for Mars (CRISM) instrument onboard Mars Reconnaissance Orbiter (MRO), Smith et al. (2018) show that CO density can undergo a strong seasonal variation. Hence, the collisional chemistry of CO strongly determines its neutral density in the Martian upper atmosphere and consequently the observed CO+ first-negative emission intensity.
As is shown in Fig. 1, the CO2 density profiles of the MCD and MGIT models are closer to the NGIMS/MAVEN in situ measurements. However, it should be noticed that the CO2 density of the MCD model is smaller than that of the MGIT model by a factor 3–5. However, in contrast, the CO density of the MCD modelis higher compared to that of the MGIT model by a factor 2 to 10. The differences between CO and CO2 densities of these models lead to an order of magnitude higher in the CO/CO2 volume mixing ratio in the MCD model when compared to that in the MGIT model (see dashed curves in Fig. 1). This significant change in the CO/CO2 volume mixing ratios may be due to the photochemistry of CO, which is incorporated in these general circulation models. Though the major photochemical production and loss reactions of CO are incorporated in these models, the CO density profiles in both models are not sufficient in order to explain the IUVS/MAVEN observation. This suggests that probably the CO density profiles are underestimated during the IUVS/MAVEN observation period. Hence, based on our model calculations, we suggest that the role of CO is more important than that of CO2 and the observed limb intensity profile of this band emission can be used as a good tracer to study the CO volume mixing ratio and also its seasonal variation for the altitudes above 150 km. The retrieval of CO density profiles based on the CO+ first-negative band also helps to understand the production and loss of CO, which is primarily linked with CO2 density and also collisional chemistry in the Martian upper atmosphere. However, it should be noted that the thermospheric temperature can play an important role in determining the CO2 density at the altitudes above 150 km. By using CO ultraviolet doublet emission at 289 nm, Jain et al. (2020) recently measured the first ever thermospheric temperature at an altitude of 170 km during the planetary encircling dust event of 2018. They observed that the mean temperature of thermosphere can be increased as high as 20 K at higher latitudes during the global dust event. Thus for a high thermosphere temperature (about 300 K), the contribution of CO2, via photon and electron impact dissociative ionisation, can also be significant in regards to the total CO+ first-negative band emission. Hence, the modelling of this band emission by incorporating the primary production processes is essential to derive the CO density based on the observed emission intensity profiles.
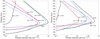 |
Fig. 4 Calculated volume emission rate profiles of CO+(B2Σ+) in the Martian upper atmosphere via various production mechanisms using neutral density profiles from MCD (left panel) and MGIT (right panel) models for SZA 75°. We note that hν and eph represent solar photon and suprathermal electron, respectively. |
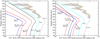 |
Fig. 5 Comparison between modelled CO+ first-negative (0–0) band emission limb intensity profiles for different excitation mechanisms, using neutral densities from MCD (left panel) and MGIT (right panel) models as well as the IUVS/MAVEN observation. The dashed, double-dotted orange curve represents the IUVS/MAVEN observed average intensity of CO+ first-negative (0–0) band emission on 7 April 2016 and the grey shaded area is its 1σ uncertainty (taken from Stevens et al. 2019). Here Case-A and Case-B are the limb intensity profiles for the total ionisation of CO (photon + photoelectron), which were modelled by increasing the CO density in the MCD and MGIT models by a factor of 3 and 8, respectively. We note that hν and eph represent solar photon and suprathermal electron, respectively. |
4 Summary and conclusions
IUVS onboard MAVEN recently observed the first ever CO+ first-negative band emission in the Martian upper atmosphere (Stevens et al. 2019). We have studied the photochemistry of this band emission by incorporating various CO+(B2Σ+) formation processes and the neutral densities of the upper atmosphere from the MCD and MGIT models. By comparing the modelled limb intensity profiles with the IUVS/MAVEN measurements, we found that CO2 is not a suitable candidate to explain the observed intensity profile of CO+ first-negative band emission. By increasing the input CO density (by a factor of 3 and 8 in the MCD and MGIT models, respectively), the modelled CO+ first-negative band intensity profile is in agreement with IUVS/MAVEN observation, which suggests that a large amount of CO was present during the observation period. In this case, the observed emission intensity is significantly governed by the ionisation of CO by both photons and electrons. Since CO significantly contributes to this emission, we suggest that the observed band intensity can be used to retrieve CO abundance in the Martian upper atmosphere for the altitudes above 150 km. The derivation of CO density based on the observed CO+ first-negative emission intensity profile also helps to constrain its volume mixing ratio in the general circulation models as well as to study the stability of CO2 in the Martian upper atmosphere. More observations of this band emission along with modelling are essential to constrain the CO volume mixing ratio and its variation during different seasonal conditions in the Martian upper atmosphere.
Acknowledgements
The neutral and ion number densities used in the present study have been taken from MAVEN/NGIMS data which is accessible through the web link https://pds-atmospheres.nmsu.edu. We would like to thank Prof. Stephen Bougher for providing the neutral density profiles from MGIT model. S.R. is supported by Department of Science and Technology (DST) with Innovation in Science Pursuit for Inspired Research (INSPIRE) faculty award [grant:dst/inspire/04/2016/002687], and he would like to thank Physical Research Laboratory for facilitating conducive research environment. The authors would like to thank the reviewer for the valuable comments and suggestions that improved the manuscript.
References
- Ajello, J. M. 1971, J. Chem. Phys., 55, 3169 [NASA ADS] [CrossRef] [Google Scholar]
- Arqueros, F., & Campos, J. 1981, J. Phys. B At. Mol. Phys., 14, 2159 [CrossRef] [Google Scholar]
- Arqueros, F., & Campos, J. 1982, Physica, 112, 131 [Google Scholar]
- Atreya, S. K., & Gu, Z. G. 1994, J. Geophys. Res., 99, 13133 [NASA ADS] [CrossRef] [Google Scholar]
- Atreya, S. K., & Gu, Z. G. 1995, Adv. Space Res., 16, 57 [NASA ADS] [CrossRef] [Google Scholar]
- Avakyan, S. V., II’in, R. N., Lavrov, V. M., & Ogurtsov, G. N. 1998, Collision Processes and Excitation of UV Emission from Planetary Atmospheric Gases: A Handbook of Cross Sections (New York: Gordon and Breach Science Publishers) [Google Scholar]
- Barth, C. A. 1969, Appl. Opt., 8, 1295 [NASA ADS] [CrossRef] [Google Scholar]
- Barth, C. A., Hord, C. W., Pearce, J. B., et al. 1971, J. Geophys. Res., 76, 2213 [CrossRef] [Google Scholar]
- Benna, M., & Elrod, M. 2018, NGIMS PDS Software Interface Specification, Revision 1.9 [Google Scholar]
- Bertaux, J.-L., Leblanc, F., Witasse, O., et al. 2005, Nature, 435, 790 [CrossRef] [Google Scholar]
- Bhardwaj, A. 1999, J. Geophys. Res., 104, 1929 [NASA ADS] [CrossRef] [Google Scholar]
- Bhardwaj, A., & Jain, S. K. 2013, J. Geophys. Res. Space Phys., 118, 3660 [CrossRef] [Google Scholar]
- Bhardwaj, A., Haider, S. A., & Singhal, R. P. 1990, Icarus, 85, 216 [NASA ADS] [CrossRef] [Google Scholar]
- Bhardwaj, A., Haider, S. A., & Singhal, R. P. 1996, Icarus, 120, 412 [NASA ADS] [CrossRef] [Google Scholar]
- Bougher, S. W., Pawlowski, D., Bell, J. M., et al. 2015, J. Geophys. Res. Planets, 120, 311 [CrossRef] [Google Scholar]
- Bougher, S. W., Roeten, K. J., Olsen, K., et al. 2017, J. Geophys. Res. Space Phys., 122, 1296 [Google Scholar]
- Conway, R. R. 1981, J. Geophys. Res., 86, 4767 [CrossRef] [Google Scholar]
- Cox, C., Gérard, J. C., Hubert, B., Bertaux, J. L., & Bougher, S. W. 2010, J. Geophys. Res., 115, E04010 [Google Scholar]
- Deighan, J., Jain, S. K., Chaffin, M. S., et al. 2018, Nat. Astron., 2, 802 [CrossRef] [Google Scholar]
- Eparvier, F. G., Chamberlin, P. C., Woods, T. N., & Thiemann, E. M. B. 2015, Space Sci. Rev., 195, 293 [NASA ADS] [CrossRef] [Google Scholar]
- Evans, J. S., Stevens, M. H., Lumpe, J. D., et al. 2015, Geophys. Res. Lett., 42, 9040 [CrossRef] [Google Scholar]
- Fox, J. L., & Dalgarno, A. 1979, J. Geophys. Res., 84, 7315 [CrossRef] [Google Scholar]
- Gérard, J.-C., Gkouvelis, L., Ritter, B., et al. 2019, J. Geophys. Res. Space Phys., 124, 5816 [CrossRef] [Google Scholar]
- Gkouvelis, L., Gérard, J. C., Ritter, B., et al. 2018, J. Geophys. Res. Planets, 123, 3119 [CrossRef] [Google Scholar]
- Gkouvelis, L., Gérard, J. C., Ritter, B., et al. 2020, Icarus, 341, 113666 [CrossRef] [Google Scholar]
- González-Galindo, F., López-Valverde, M. A., Angelats i Coll, M., & Forget, F. 2005, J. Geophys. Res. Planets, 110, E09008 [CrossRef] [Google Scholar]
- González-Galindo, F., López-Valverde, M. A., Forget, F., et al. 2015, J. Geophys. Res. Planets, 120, 2020 [CrossRef] [Google Scholar]
- Gronoff, G., Wedlund, C. S., Mertens, C. J., & Lillis, R. J. 2012a, J. Geophys. Res. Space Phys., 117, A04306 [Google Scholar]
- Gronoff, G., Wedlund, C. S., Mertens, C. J., et al. 2012b, J. Geophys. Res. Space Phys., 117, A05309 [Google Scholar]
- Huebner, W. F., Keady, J. J., & Lyon, S. P. 1992, Astrophys. Space Sci., 195, 1 [Google Scholar]
- Jain, S. K., & Bhardwaj, A. 2011, J. Geophys. Res. Planets, 116, E07005 [Google Scholar]
- Jain, S. K., & Bhardwaj, A. 2012, Planet. Space Sci., 64, 110 [CrossRef] [Google Scholar]
- Jain, S. K., Stewart, A. I. F., Schneider, N. M., et al. 2015, Geophys. Res. Lett., 42, 9023 [CrossRef] [Google Scholar]
- Jain, S. K., Bougher, S. W., Deighan, J., et al. 2020, Geophys. Res. Lett., 47, e85302 [CrossRef] [Google Scholar]
- Krasnopolsky, V. A. 1993, Icarus, 101, 33 [NASA ADS] [CrossRef] [Google Scholar]
- Lawrence, G. 1965, J. Quant. Spectr. Rad. Transf., 5, 359 [CrossRef] [Google Scholar]
- Leblanc, F., Chaufray, J. Y., Lilensten, J., Witasse, O., & Bertaux, J. L. 2006, J. Geophys. Res. Planets, 111, E09S11 [CrossRef] [Google Scholar]
- Mantas, G. P., & Hanson, W. B. 1979, J. Geophys. Res., 84, 369 [CrossRef] [Google Scholar]
- McElroy, M. B., & Hunten, D. M. 1970, J. Geophys. Res., 75, 1188 [CrossRef] [Google Scholar]
- McElroy, M. B., Kong, T. Y., Yung, Y. L., & Nier, A. O. 1976, Science, 194, 1295 [NASA ADS] [CrossRef] [Google Scholar]
- Nair, H., Allen, M., Anbar, A. D., Yung, Y. L., & Clancy, R. T. 1994, Icarus, 111, 124 [NASA ADS] [CrossRef] [PubMed] [Google Scholar]
- Nier, A. O., & McElroy, M. B. 1977, J. Geophys. Res., 82, 4341 [NASA ADS] [CrossRef] [Google Scholar]
- Plummer, E. W., Gustafsson, T., Gudat, W., & Eastman, D. E. 1977, Phys. Rev. A, 15, 2339 [CrossRef] [Google Scholar]
- Qin, J. 2020, AJ, 159, 206 [CrossRef] [Google Scholar]
- Raghuram, S., & Bhardwaj, A. 2012, Planet. Space Sci., 63, 139 [NASA ADS] [CrossRef] [Google Scholar]
- Raghuram, S., & Bhardwaj, A. 2013, Icarus, 223, 91 [NASA ADS] [CrossRef] [Google Scholar]
- Ritter, B., Gérard, J. C., Gkouvelis, L., et al. 2019, J. Geophys. Res. Space Phys., 124, 4809 [CrossRef] [Google Scholar]
- Samson, J. A. R., Bougher, J. L., & Gardner 1976, J. Electron Spectr. Relat. Phenomena., 8, 35 [CrossRef] [Google Scholar]
- Scholl, T. J., Rosner, S. D., & Holt, R. A. 1998, Can. J. Phys., 76, 39 [Google Scholar]
- Shematovich, V. I., Bisikalo, D. V., Gérard, J. C., et al. 2008, J. Geophys. Res. Planets, 113, E02011 [CrossRef] [Google Scholar]
- Simon, C., Witasse, O., Leblanc, F., Gronoff, G., & Bertaux, J. L. 2009, Planet. Space Sci., 57, 1008 [CrossRef] [Google Scholar]
- Singhal, R. P., & Haider, S. A. 1984, J. Geophys. Res., 89, 6847 [NASA ADS] [CrossRef] [Google Scholar]
- Smith, M. D., Daerden, F., Neary, L., & Khayat, A. 2018, Icarus, 301, 117 [NASA ADS] [CrossRef] [Google Scholar]
- Stevens, M. H., Siskind, D. E., Evans, J. S., et al. 2019, J. Geophys. Res. Planets, 124, 1226 [Google Scholar]
- Stiepen, A., Gérard, J. C., Bougher, S., et al. 2015, Icarus, 245, 295 [CrossRef] [Google Scholar]
- Strickland, D. J., Thomas, G. E., & Sparks, P. R. 1972, J. Geophys. Res., 77, 4052 [CrossRef] [Google Scholar]
- Thiemann, E. M. B., Chamberlin, P. C., Eparvier, F. G., et al. 2017, J. Geophys. Res. Space Phys., 122, 2748 [Google Scholar]
- van der Wiel, M. J., & Brion, C. 1972, J. Electron Spectr. Relat. Phenomena, 1, 309 [CrossRef] [Google Scholar]
- Wu, C. Y. R., & Judge, D. L. 1986, J. Chem. Phys., 84, 4720 [CrossRef] [Google Scholar]
All Figures
|
Fig. 1 Number density profiles of CO2 and CO from MCD and MGIT models. Solid and dash-dotted curves represent CO2 and CO density profiles, respectively. The grey shaded area represents the variation in the NGIMS/MAVEN measured CO2 density from 6–8 April 2016 for the orbits #2953–2962. The solid black curve in the shaded area represents the averaged value of CO2 from the NGIMS/MAVEN measurements. The calculated CO/CO2 volume mixing ratio profiles are plotted with dashed curves with a scale on top of the x-axis. |
| In the text | |
|
Fig. 2 Photoionisation cross sections of CO2 and CO producing CO+(B2Σ+), which are taken from Wu & Judge (1986) and Plummer et al. (1977), respectively. The cross section of Wu & Judge (1986) is linearly extrapolated for the wavelength below 180 Å. The daily-averaged solar flux for the wavelengths below 800 Å, which was obtained from the measurements of the Solar Extreme Ultraviolet Monitor instrument onboard MAVEN on 7 April 2016 for the orbit #2960 (Eparvier et al. 2015), is plotted with a scale on the right y-axis. |
| In the text | |
|
Fig. 3 Electron impact ionisation cross sections of CO2 and CO producing CO+(B2Σ+) which are taken from Ajello (1971) and Arqueros & Campos (1981), respectively. Modelled steady state suprathermal electron flux (red solid curve) at an altitude of 130 km using MCD neutral density profile and for SZA of 75° is plotted with a scale on the right y-axis. |
| In the text | |
|
Fig. 4 Calculated volume emission rate profiles of CO+(B2Σ+) in the Martian upper atmosphere via various production mechanisms using neutral density profiles from MCD (left panel) and MGIT (right panel) models for SZA 75°. We note that hν and eph represent solar photon and suprathermal electron, respectively. |
| In the text | |
|
Fig. 5 Comparison between modelled CO+ first-negative (0–0) band emission limb intensity profiles for different excitation mechanisms, using neutral densities from MCD (left panel) and MGIT (right panel) models as well as the IUVS/MAVEN observation. The dashed, double-dotted orange curve represents the IUVS/MAVEN observed average intensity of CO+ first-negative (0–0) band emission on 7 April 2016 and the grey shaded area is its 1σ uncertainty (taken from Stevens et al. 2019). Here Case-A and Case-B are the limb intensity profiles for the total ionisation of CO (photon + photoelectron), which were modelled by increasing the CO density in the MCD and MGIT models by a factor of 3 and 8, respectively. We note that hν and eph represent solar photon and suprathermal electron, respectively. |
| In the text | |
Current usage metrics show cumulative count of Article Views (full-text article views including HTML views, PDF and ePub downloads, according to the available data) and Abstracts Views on Vision4Press platform.
Data correspond to usage on the plateform after 2015. The current usage metrics is available 48-96 hours after online publication and is updated daily on week days.
Initial download of the metrics may take a while.