Fig. 1
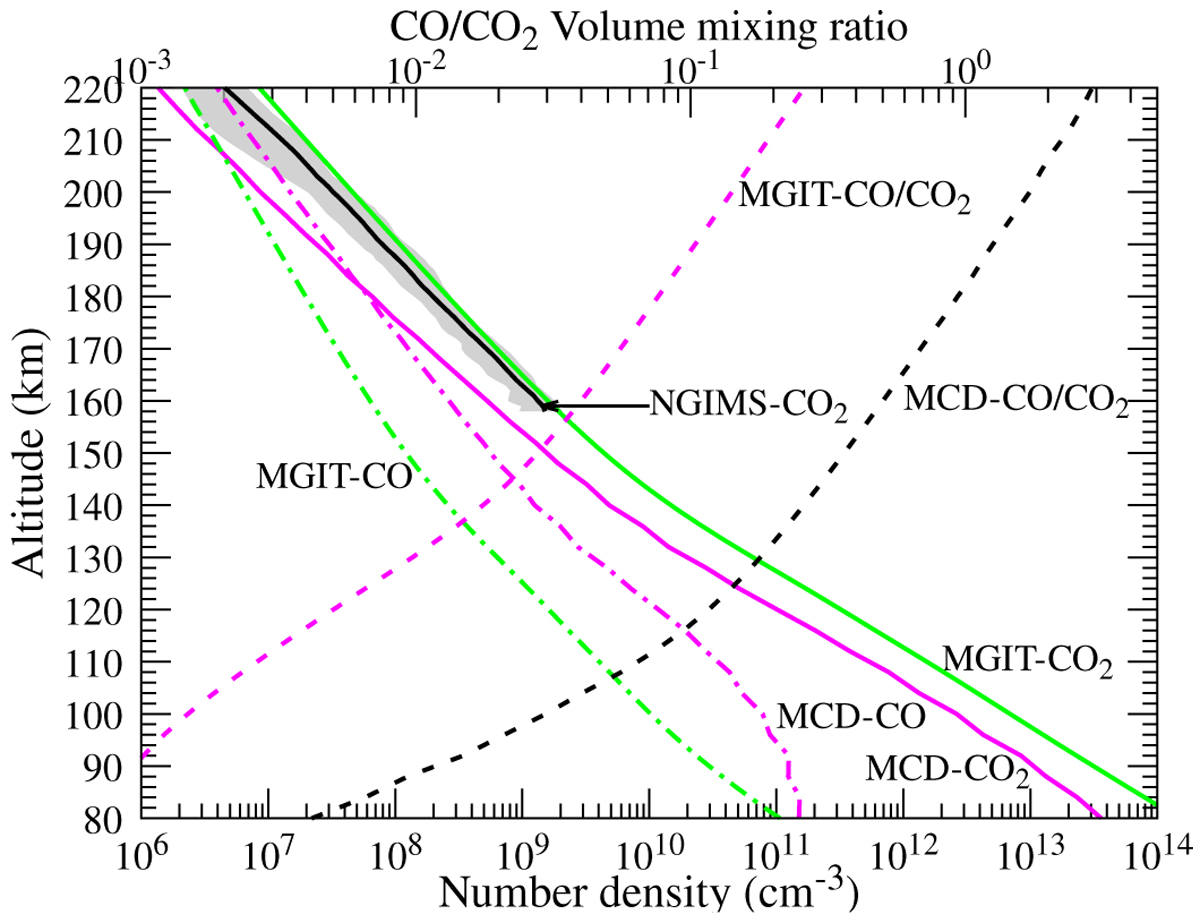
Number density profiles of CO2 and CO from MCD and MGIT models. Solid and dash-dotted curves represent CO2 and CO density profiles, respectively. The grey shaded area represents the variation in the NGIMS/MAVEN measured CO2 density from 6–8 April 2016 for the orbits #2953–2962. The solid black curve in the shaded area represents the averaged value of CO2 from the NGIMS/MAVEN measurements. The calculated CO/CO2 volume mixing ratio profiles are plotted with dashed curves with a scale on top of the x-axis.
Current usage metrics show cumulative count of Article Views (full-text article views including HTML views, PDF and ePub downloads, according to the available data) and Abstracts Views on Vision4Press platform.
Data correspond to usage on the plateform after 2015. The current usage metrics is available 48-96 hours after online publication and is updated daily on week days.
Initial download of the metrics may take a while.