Fig. 5
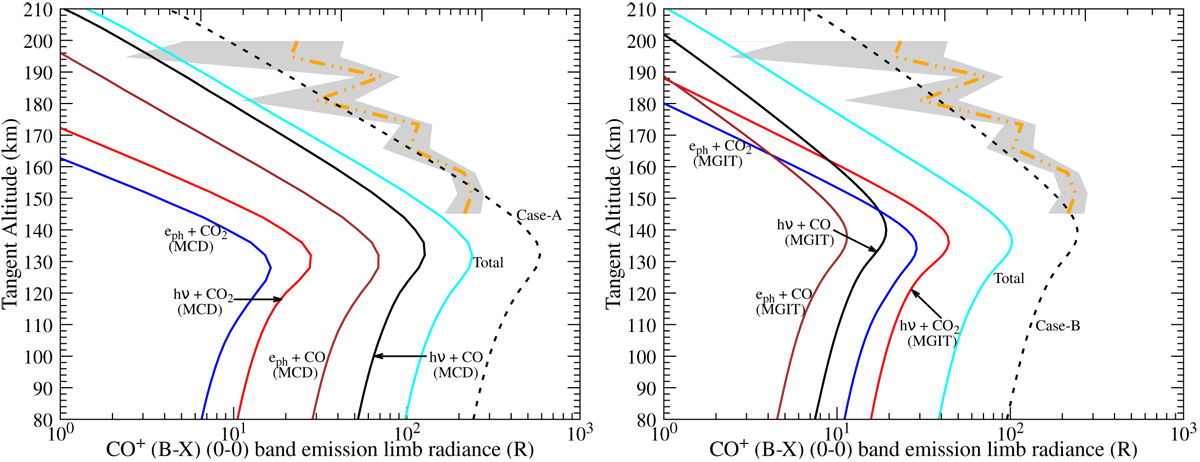
Comparison between modelled CO+ first-negative (0–0) band emission limb intensity profiles for different excitation mechanisms, using neutral densities from MCD (left panel) and MGIT (right panel) models as well as the IUVS/MAVEN observation. The dashed, double-dotted orange curve represents the IUVS/MAVEN observed average intensity of CO+ first-negative (0–0) band emission on 7 April 2016 and the grey shaded area is its 1σ uncertainty (taken from Stevens et al. 2019). Here Case-A and Case-B are the limb intensity profiles for the total ionisation of CO (photon + photoelectron), which were modelled by increasing the CO density in the MCD and MGIT models by a factor of 3 and 8, respectively. We note that hν and eph represent solar photon and suprathermal electron, respectively.
Current usage metrics show cumulative count of Article Views (full-text article views including HTML views, PDF and ePub downloads, according to the available data) and Abstracts Views on Vision4Press platform.
Data correspond to usage on the plateform after 2015. The current usage metrics is available 48-96 hours after online publication and is updated daily on week days.
Initial download of the metrics may take a while.