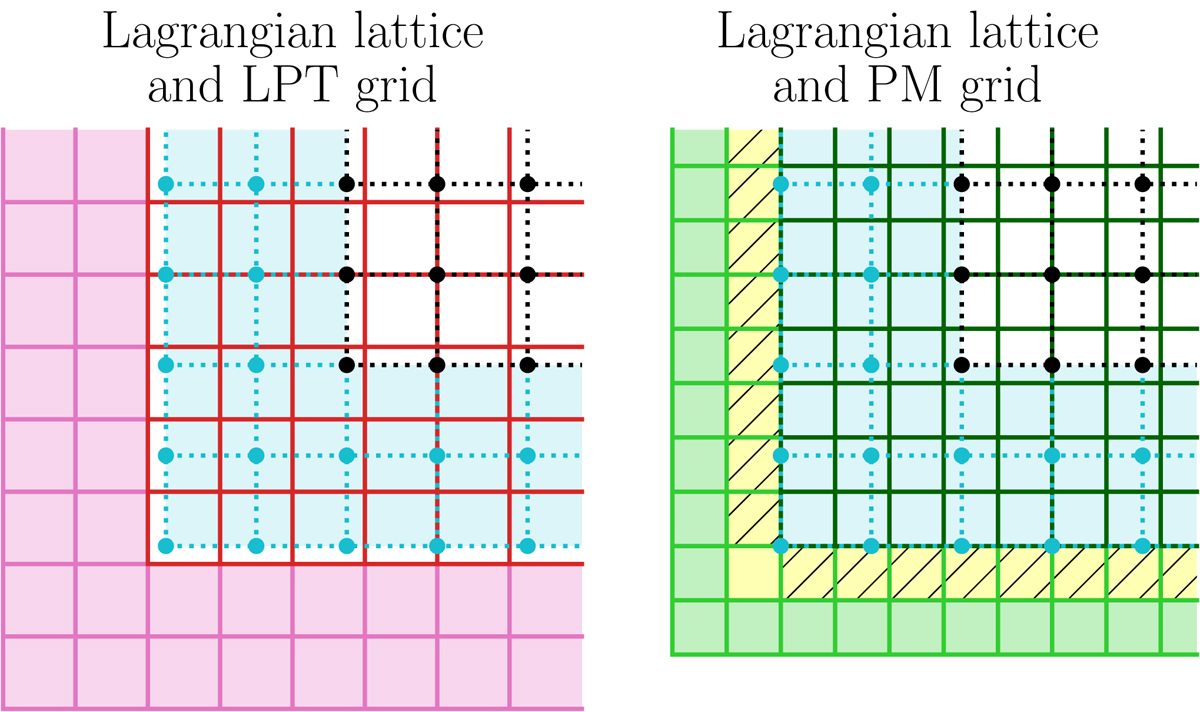
Fig. 2.

Illustration of the different grids used within sCOLA. The Lagrangian lattice is represented by dashed lines. For each tile, central particles (in black) are surrounded by buffer particles (in cyan), which are ignored at the end of the evolution. The corresponding buffer region in other grids is represented in cyan. The left panel represents the “LPT grid” on which Lagrangian potentials ![]() and
and ![]() are defined. The central region has
are defined. The central region has ![]() grid points (in red) and is padded by 2Nghost cells in each direction (pink region). The right panel shows the “PM grid” on which the density contrast δsCOLA, the gravitational potential ΦsCOLA, and the accelerations
grid points (in red) and is padded by 2Nghost cells in each direction (pink region). The right panel shows the “PM grid” on which the density contrast δsCOLA, the gravitational potential ΦsCOLA, and the accelerations ![]() are defined. The density contrast is defined only in the central region (which has
are defined. The density contrast is defined only in the central region (which has ![]() grid points, in dark green). The gravitational potential is padded by 2Nghost cells in each direction (light green and yellow regions), and the gridded accelerations only by Nghost cells in each direction (yellow region). Solving the Poisson equation requires Dirichlet boundary conditions in six layers of Nghost cells, denoted as hatched regions. For simplicity of representation, we have used here Nghost = 1.
grid points, in dark green). The gravitational potential is padded by 2Nghost cells in each direction (light green and yellow regions), and the gridded accelerations only by Nghost cells in each direction (yellow region). Solving the Poisson equation requires Dirichlet boundary conditions in six layers of Nghost cells, denoted as hatched regions. For simplicity of representation, we have used here Nghost = 1.
Current usage metrics show cumulative count of Article Views (full-text article views including HTML views, PDF and ePub downloads, according to the available data) and Abstracts Views on Vision4Press platform.
Data correspond to usage on the plateform after 2015. The current usage metrics is available 48-96 hours after online publication and is updated daily on week days.
Initial download of the metrics may take a while.


