Open Access
Fig. B.3.
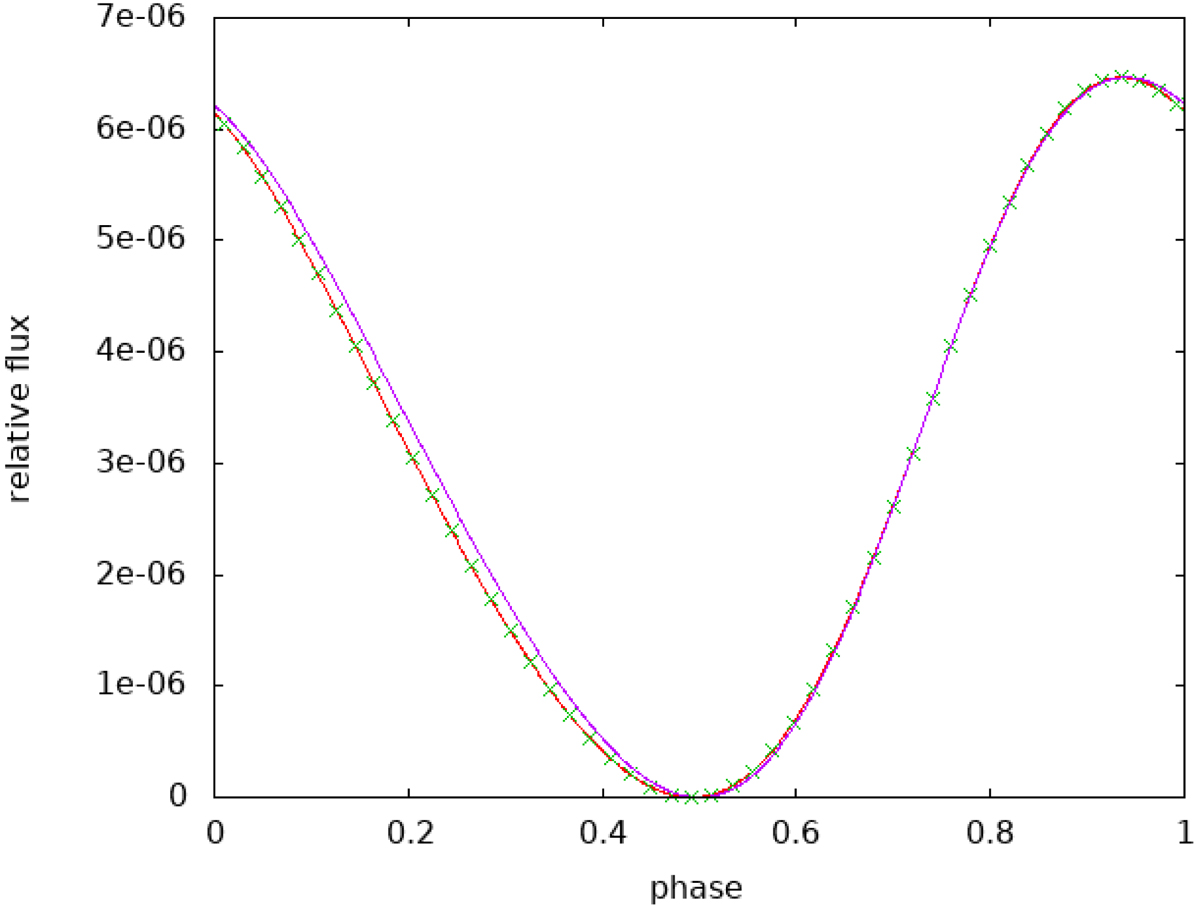
Flux received in the Minkowskian case for a line of sight and a magnetic axis that form an angle of 45° with the rotation axis. The emission from each of the polar caps is shown as the dotted line, the sum of the two is shown in red, and the sum without the flight time is plotted in purple.
Current usage metrics show cumulative count of Article Views (full-text article views including HTML views, PDF and ePub downloads, according to the available data) and Abstracts Views on Vision4Press platform.
Data correspond to usage on the plateform after 2015. The current usage metrics is available 48-96 hours after online publication and is updated daily on week days.
Initial download of the metrics may take a while.