| Issue |
A&A
Volume 638, June 2020
|
|
|---|---|---|
| Article Number | L10 | |
| Number of page(s) | 5 | |
| Section | Letters to the Editor | |
| DOI | https://doi.org/10.1051/0004-6361/202038158 | |
| Published online | 23 June 2020 | |
Letter to the Editor
Star formation in outer rings of S0 galaxies
III. UGC 5936: An S0 with currently accreted satellite matter
1
Sternberg Astronomical Institute of the Lomonosov Moscow State University, University av. 13, 119234 Moscow, Russia
e-mail: This email address is being protected from spambots. You need JavaScript enabled to view it.
2
Special Astrophysical Observatory of the Russian Academy of Sciences, Nizhnij Arkhyz 369167, Russia
e-mail: This email address is being protected from spambots. You need JavaScript enabled to view it.
Received:
13
April
2020
Accepted:
18
May
2020
Abstract
Aims. Even though S0 galaxies are usually thought to be ‘red and dead’, they often demonstrate star formation organised in ring structures. We try to clarify the nature of this phenomenon and the difference between this occurrence and star formation in spiral galaxies. The luminous S0 galaxy with a large ring, UGC 5936, is studied in this work.
Methods. We measured gas and star kinematics by applying long-slit spectroscopy along the major axis of UGC 5936, as well as Lick indices for the main body of the galaxy and strong emission-line flux ratios in the ring. After inspecting the gas excitation in the ring using line ratio diagnostic diagrams and having ensured that it is ionised mostly by young stars, we determined the gas oxygen abundance with popular strong-line methods. We also proved the spatial proximity of the south-eastern dwarf satellite to UGC 5936 and measured its gas metallicity.
Results. The ionised gas of the ring is excited by young stars and has solar metallicity. Star formation in the ring is rather prolonged and its intensity corresponds to the current HI content of UGC 5936 (to the Kennicutt-Schmidt relation). The whole morphology of the HI distribution implies current accretion of the cold gas from the satellite onto the outer disc of UGC 5936. The accretion being smooth and laminar provides a favourable condition for star formation ignition; this is a consequence of the satellite location and rotation in the plane of the stellar disc of the host galaxy.
Key words: galaxies: elliptical and lenticular, cD / galaxies: evolution / galaxies: structure / galaxies: star formation / galaxies: interactions / galaxies: individual: UGC 5936
© ESO 2020
1. Introduction
Rings are common attributes of S0 galaxies by the definition of this morphological type. As mentioned by de Vaucouleurs (1959) in reference to Hubble, there are two groups of S0 objects: those with smooth lenses and envelopes and those showing some structure in the envelope in the form of a dark zone and ring. Surface photometry reveals that about 50% of S0-S0/a galaxies possess outer stellar rings (Comerón et al. 2014; Laurikainen et al. 2011). In most cases, the nature of these rings cannot be attributed to bar resonances. This contrasts with how this phenomenon has been commonly treated in a wider sample of spiral ringed galaxies (Buta 1986). Just the occurrence of bar structures falls in S0s with respect to spiral galaxies; according to statistics by Laurikainen et al. (2009), only 46% of S0s show some signs of bars against 64%–69% among spirals, and these bars are mostly weak (Buta et al. 2010). Among the outer stellar rings, about 50% are also seen in ultraviolet (UV) (Kostiuk & Sil’chenko 2015) thereby betraying recent star formation and probably being expected to contain some amount of gas to fuel this star formation. The gas origin in S0s is still controversial; even less is known about star formation in S0s providing stellar ring structures. In this Letter, we consider UGC 5936, which is a luminous (R)SA0+ galaxy located in the northern sky (MH = −24.86; NASA/IPAC Extragalactic Database; NED). The optical-band ring and the first spectral results for this galaxy were reported by Kostyuk (1975) and Kostyuk et al. (1981). In Ilyina & Sil’chenko (2011), we noted that the UV ring of this galaxy matches the geometry of the optical blue ring. The galaxy was observed in a 21 cm line and was found to be a rather gas-rich S0, with 1.38 × 10⁹ M⊙ of the neutral hydrogen (Wang et al. 2013). The distance to the galaxy is 108 Mpc and the linear scale is about 0.5 kpc per arcsec (NED). This paper is a part of our series about the origin of star-forming rings in S0 galaxies; earlier NGC 6534 and MCG 11-22-015 are described by Sil’chenko et al. (2018) and NGC 4513 is described by Proshina et al. (2020).
2. Observations and the data involved
Our long-slit spectral observations were made with a multi-mode focal reducer SCORPIO-2 (Afanasiev & Moiseev 2011) at the prime focus of the Russian 6 m telescope of the Special Astrophysical Observatory, Russian Academy of Sciences. UGC 5936 was observed on February 28, 2014. In these observations, the 1″ slit was aligned with the major axis, PA(slit) = 83deg, and the total exposure time was 75 min; also the target was exposed in the orientation through the neighbouring dwarf galaxy, PA(slit) = 135deg, with the exposure time of 45 min. The seeing during these observations was mediocre, FWHM = 3″. We used the VPHG1200@540 grism providing an intermediate spectral resolution FWHM ≈ 5 Å in the wavelength region from 3700 Å to 7200 Å. This spectral range includes a set of strong absorption and emission lines making it suitable to analyse both stellar and gaseous kinematics of the galaxy as well as the gas excitation and chemistry and properties of the stellar populations. The slit is 6′ in length, which allowed us to use the edge spectra for subtraction of the sky background. The CCD E2V CCD42-90, with a format of 2048 × 4600, using in the 1 × 2 binning mode provided a spatial scale of 0.357 ″/px and a spectral sampling of 0.86 Å/px. The data reduction as well as kinematics and stellar population characteristics derivation were standard for our SCORPIO-2 data; see for example Sil’chenko et al. (2019) or Proshina et al. (2020). We used the gr-band images from the SDSS/DR9 archive (Ahn et al. 2012) to study the large-scale structure of the galaxy.
3. Photometric and dynamical structure of UGC 5936
The smooth lenticular galaxy UGC 5936 (see 2MASS J-band image, Fig. 1, lower middle) possesses a large pseudo-ring which looks unclosed in the optical continuum bands (Fig. 1, upper left). However Fig. 1 (lower right), which shows the WISE/W3 data in the 12 μm band delineates a perfect closed ring; in this figure hot dust heated by star formation reveals its organisation in a typical S0 outer ring structure. The colour map (Fig. 1, upper right), demonstrates the blue colour of the ring, which is narrow to the east and splits into two arcs to the west, as well as the red colour of the arc connecting the core and the western part of the ring. The western blue-ring structures correspond to the ring in the unsharp-masked image (Fig. 1, upper middle). Interestingly, the GALEX near-ultraviolet (NUV) map (Fig. 1, lower left), which also refers to young star concentration, shows UV flux excesses beyond the borders of the continuum-band pseudo-ring; the offset is seen especially well at the major axis. To the south-east from UGC 5936, a small satellite, SDSS J105009.10+362009.9, is observed at 15 kpc projected onto the sky plane; this satellite is observed at 19 kpc if we suggest that it lies in the plane of the UGC 5936 disc. This small satellite is very blue. According to SDSS/DR9, the magnitude difference between UGC 5936 and its satellite is 5.64m in the g band and 6.2m in the r band, thus it is a bona fide dwarf that has MB ≈ −15m and a stellar mass of about 108 M⊙ if we apply a mass-to-light ratio corresponding to its colour g − r = 0.27 (Bell et al. 2003).
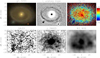 |
Fig. 1. All maps available for UGC 5936. Upper row: combined continuum-band optical image from the SDSS, r-band unsharp-masked image from the SDSS, and (g − r) colour image. Lower row: GALEX NUV image, 2MASS J-band image, and WISE/W3 12 μm band image. |
The ring of UGC 5936 could be classified as an outer ring since its radius is about 15 kpc. However the galaxy is very large and we trace the isophote characteristics to about 22.5 kpc from the centre. The results of the isophote analysis are presented in Fig. 2 (two left plots) and in the right plot we show an azimuthally averaged radial surface brightness profile in the r band. At R ≈ 5″ the local ellipticity maximum and major-axis position angle twist reveal a strong triaxiality of the (pseudo)bulge. The regular behaviour of the isophote characteristics is observed at radii beyond R = 25″ and starting from this radius outwards we see a classical exponential disc with a scale length of h = 7.4″ ± 0.1″, or 3.5 kpc. However, it is a Freeman’s Type II profile (Freeman 1970): a large portion of the inner profile lies below the continuation of the exponential fit inwards. In the radius range of 10″–20″ (5–10 kpc), between the pseudobulge and the exponential stellar disc, we see an extended ‘lens’ component, with fairly flat surface brightness profile.
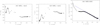 |
Fig. 2. Results of the photometric analysis of the SDSS/DR9 data. The right plot presents the derived surface-brightness radial profile, and the blue dashed line is a fitted exponential law showing the area of disc domination in UGC 5936. |
Interestingly, opposite to common expectations originating perhaps from classical works by John Kormendy (e.g. Kormendy 1984), the lens of UGC 5936 is dynamically cold. By inspecting the profile of the stellar velocity dispersion (Fig. 3, right plot), we find that the stellar velocity dispersion in the lens is comparable to that in the outer stellar disc, at least to the east from the nucleus. The western part of UGC 5936 is more perturbed by outer matter accretion as the gas component also demonstrates (see Sect. 5 concerning ionised-gas excitation). The rotation velocity profiles of the gas and stars (Fig. 3, left plot) are identical, therefore we may be sure that the ionised gas rotates in the main galactic plane sharing the spin with the stellar disc. The line-of-sight velocity of the satellite, 7045 km s−1, is very close to the outer velocities of the stars and gas in the disc of UGC 5936, 7100 km s−1 and 7080 km s−1 respectively; thus the orbital spin of the satellite is probably similar to the rotation spin of UGC 5936. This is a very favourable configuration for smooth gas accretion from the satellite into the disc of UGC 5936.
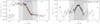 |
Fig. 3. Line-of-sight velocity profiles for the ionised gas and stars and the stellar velocity dispersion profile in UGC 5936 along its major axis. The stars show the stellar component; the different red signs relate to multiple emission lines of the ionised gas. The vertical shaded lanes designate different structure components of the galaxy labelled in the left panel. |
4. Stellar population properties
We estimated the properties of the stellar population along the radius of the major-axis cross-section of UGC 5936 using Lick indices. The results are presented in Fig. 4. The left plot representing Mgb versus iron index diagram gives an estimation of the magnesium-to-iron ratio through a comparison of our measurements with the models by Thomas et al. (2003) for multiple Mg/Fe ratios. The magnesium-to-iron ratio characterising the duration of star formation (Matteucci & Greggio 1986; Matteucci 1994) is supersolar in the nucleus and in the bulge, but it is solar in the lens and the disc. This gives further the evidence in favour of the disc origin of the lens. By confronting the Hβ Lick index versus a combined metallicity Lick index involving magnesium and iron lines in the right plot, we solve the metallicity-age degeneracy and determine these stellar-population parameters. The stellar metallicities of the lens and disc are similar, that is about one-half or one-third of the solar. But the mean stellar ages are very different. The lens is very old (older than 10 Gyr), its age is comparable to Galactic globular clusters; the mean age of the stellar population in the inner disc, where the contribution of the blue ring is significant, is only about 2 Gyr.
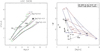 |
Fig. 4. Lick index-index diagrams for UGC 5936. The left plot presents Mgb versus iron index diagram for the UGC 5936 structure components in comparison with the models by Thomas et al. (2003) for multiple Mg/Fe ratios. In the Hβ Lick index versus a combined metallicity Lick index diagram (right plot), five age sequences (red lines) are plotted as a reference frame; the blue lines crossing the model age sequences indicate the metallicities of +0.67, +0.35, 0.00, –0.33 from right to left. A large black star corresponds to the central core, and then the measurements are shown through the galaxy structure components: R = 4″ − 10″(pseudobulge), R = 10″ − 20″(lens), and R = 20″ − 40″(disc). A few globular clusters from Kim et al. (2016) belonging to the Galactic bulge and thick disc are also plotted to delineate the empirical old-age sequence for the metallicities below [Z/H] = − 0.4. |
5. Gas-phase metallicity
In the main body of UGC 5936 the emission line Hα is not detected, and the strongest emission line is [NII]λ6583. Such an emission-line pattern is consistent with the possible gas excitation by old stars (Binette et al. 1994; Byler et al. 2019), that is in agreement with the age of the stellar population in the central part of UGC 5936. In the ring, where strong Hα emission lines are seen at the radii R = 28″ to the east and R = 25″ to the west, we expect gas excitation by current star formation. We plot the emission-line ratios for the ring onto the Baldwin-Phillips-Terlevich (BPT) diagram (Fig. 5, left plot). The strong-line ratios in the ring of UGC 5936 appear to lie below the theoretical border of the star formation calculated by Kewley et al. (2001), thus the ionised gas of the ring may be mostly excited by young stars. But the offset of the western part of the ring at the BPT diagram with respect to the observational star formation sequence by Kauffmann et al. (2003) puts this region into the so-called composite zone, thereby revealing a possible contribution of shocks into the excitation of the ionised gas of the ring to the west of the nucleus. The other variant of the diagnostic diagram including the Hα equivalent width (Fig. 5, right plot) shows the same separation: only the eastern side of the ring is fairly consistent with the Kauffmann et al. (2003) star formation sequence in the Cid Fernandes et al. (2010) modification. The outermost arm of the western part of the ring, at R = 28″ to the west from the nucleus, is certainly excited by shock because its log([NII]λ6583/Hα) = − 0.09 ± 0.02.
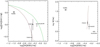 |
Fig. 5. Diagnostic diagrams for gas excitation determination. The classical BPT (Baldwin et al. 1981) diagram is shown in the left plot and an advanced version proposed by Cid Fernandes et al. (2010), including the Hα emission-line equivalent width, is shown in the right plot. The bordering lines between young star excitation, to the left of these lines, and the other mechanisms are those from Kewley et al. (2001; green dashed line) and from (Kauffmann et al. 2003; red dotted line). The black points represent the various parts of the UGC 5936 ring; the black star is the measurement of the south-eastern dwarf satellite. |
We also plot in Fig. 5 the measurements of the ionised-gas, emission-line intensity ratios for the dwarf south-eastern satellite, which has been probed by our long-slit cross-section in PA = 135°. In this galaxy, the Hα emission line dominates in the spectrum, its equivalent width is 38 Å, and the gas is unanimously excited by young stars. By taking this fact into account, we determined the gas oxygen abundance using the strong-line method. By exploring both O3N2 and N2 calibrations from Pettini & Pagel (2004) and Marino et al. (2013), we obtained for the satellite 12 + log(O/H) = 8.32 ± 0.05 dex. We must note that this value is higher by about 0.2 dex than the mean metallicity implied by the mass-metallicity relation for the galaxy of M* = 108 M⊙ as it is calibrated by Kewley & Ellison (2008) through the Pettini & Pagel (2004) approach.
For the ring of UGC 5936, for its eastern part, where there is no doubt about the HII-like excitation, the same calibrations of the strong-line metallicity indicators give 12 + log(O/H) = 8.64 ± 0.05 dex, or nearly solar oxygen abundance.
6. Discussion and conclusions: Star formation and origin of the ring in UGC 5936
As we mentioned in Sect. 3, UGC 5936 is well seen in the 12 μm band of the WISE All-Sky Survey. This fact allowed Chang et al. (2015) to determine the star formation rate (SFR) of this galaxy by analysing the full SDSS+WISE spectral energy distribution (SED): the integrated SFR of UGC 5936 is equal to 0.24 M⊙ yr−1. With the total stellar mass of 1011 M⊙ (Chang et al. 2015), this galaxy is well below the main sequence. However when we inspect the data on the neutral hydrogen in UGC 5936, with the estimate of Σ(HI) = 1 M⊙ per pc2 (Wang et al. 2013), and compare it with the SFR surface density (by dividing the total SFR by the galaxy area within R25), we ensure that the galaxy is exactly on the Kennicutt-Schmidt relation (Kennicutt 1998; Chang et al. 2015). The outer disc of the galaxy experiences normal star formation.
The map of the neutral hydrogen distribution in UGC 5936 presented by Wang et al. (2013) is very curious: it demonstrates two condensations – one centred on the western part of the UGC 5936 ring and another centred on the south-eastern satellite. The latter condensation is partly projected onto the eastern part of the UGC 5936 ring. The whole view is consistent with the HI ring in the disc plane of UGC 5936 and the probable source of the gas is the satellite. We found that the metallicity of the satellite is higher than expected for its present stellar mass; this is perhaps because the satellite is already mostly disrupted by UGC 5936 having accreted both the gas and stellar component of the satellite. The accretion proceeds in the laminar regime because the satellite co-rotates the outer disc of UGC 5936, and it results in a very normal SFR within the accreted gaseous ring for its gas content. van de Voort et al. (2018) report an opposite effect, namely, galaxy locations below the Kennicutt-Schmidt relation found for six S0s experiencing recent gas-rich minor merging. However, these authors investigated S0s with disturbed morphology, and the initial orbital configuration of the satellite merging remained then unknown. Perhaps, their particular sample galaxies experienced off-plane satellite accretion; in these cases star formation had to be suppressed (Sil’chenko et al. 2019).
The accreted gas has made at least two revolutions around UGC 5936: two star-forming arcs with different radii are seen at the western part of the ring, and the gas excitation there includes some contribution from shock waves implying collision of gas flows. The star formation in UGC 5936 – and the satellite disruption – began 1–2 Gyr ago since the orbital time at the radius of the ring is about 0.5 Gyr. Such a prolonged star formation event can also explain the solar metallicity of the ionised gas in the ring of UGC 5936, although the initial oxygen abundance of the accreted gas is lower by a factor of 3: evidently, the chemical evolution stage of the ring is very advanced, resulting in the gas metallicity saturation (Ascasibar et al. 2015; Zahid et al. 2014).
Thus UGC 5936 represents a certain example of the outer S0 ring whose origin is outer gas accretion. The source of the cold gas inflow can be firmly established in this particular case: it is a dwarf gas-rich satellite which may perhaps be completely disrupted after a few orbital periods. This may be a common way to form outer star-forming rings in S0 galaxies without bars. We visually inspected close environments of the UV-detected outer rings in S0s from the compilation by Kostiuk & Sil’chenko (2015). Within 50 kpc from a host, 70% ± 10% unbarred S0s with UV rings have a blue dwarf satellite, while only 27% ± 14% barred S0s having UV rings possess such satellites; the errors are estimated from the binomial distribution. Therefore the outer rings in barred S0s may be formed as a consequence of gas accumulation at the outer Lindblad resonances as has been argued by Athanassoula et al. (1982) and Buta (1986), but for unbarred S0s the outer ring origin through gas-rich dwarf merging seems to be more probable.
Acknowledgments
We thank the anonymous referee who has made very useful comments resulting in the paper improvement. We are grateful to Roman Uklein for the help during the observations. The study of galactic rings was supported by the Russian Foundation for Basic Researches, grant no. 18-02-00094a. The work is based on the data obtained at the Russian 6m telescope of the Special Astrophysical Observatory operated with the financial support of the Ministry of Science and Higher Education of the Russian Federation (including agreement No. 05.619.21.0016, project ID RFMEFI61919X0016) and on the public data of the SDSS (http://www.sdss3.org) survey. This research has made use of the NASA/IPAC Extragalactic Database (NED), which is funded by the National Aeronautics and Space Administration and operated by the California Institute of Technology. The NASA GALEX mission data were taken from the Mikulski Archive for Space Telescopes (MAST). The WISE data exploited by us were retrieved from the NASA/ IPAC Infrared Science Archive, which is operated by the Jet Propulsion Laboratory, California Institute of Technology, under contract with the National Aeronautics and Space Administration.
References
- Afanasiev, V. L., & Moiseev, A. V. 2011, Balt. Astron., 20, 363 [NASA ADS] [Google Scholar]
- Ahn, C. P., Alexandroff, R., Allende Prieto, C., et al. 2012, ApJS, 203, 21 [NASA ADS] [CrossRef] [Google Scholar]
- Ascasibar, Y., Gavilán, M., Pinto, M., et al. 2015, MNRAS, 448, 2126 [Google Scholar]
- Athanassoula, E., Bosma, A., Creze, M., & Schwarz, M. P. 1982, A&A, 107, 101 [NASA ADS] [Google Scholar]
- Baldwin, J. A., Phillips, M. M., & Terlevich, R. 1981, PASP, 93, 5 [NASA ADS] [CrossRef] [EDP Sciences] [Google Scholar]
- Bell, E. F., McIntosh, D. H., Katz, N., & Weinberg, M. D. 2003, ApJS, 149, 289 [NASA ADS] [CrossRef] [Google Scholar]
- Binette, L., Magris, C. G., Stasińska, G., & Bruzual, A. G. 1994, A&A, 292, 13 [NASA ADS] [Google Scholar]
- Buta, R. 1986, ApJS, 61, 609 [NASA ADS] [CrossRef] [Google Scholar]
- Buta, R., Laurikainen, E., Salo, H., & Knapen, J. H. 2010, ApJ, 721, 259 [NASA ADS] [CrossRef] [Google Scholar]
- Byler, N., Dalcanton, J. J., Conroy, C., et al. 2019, AJ, 158, 2 [NASA ADS] [CrossRef] [Google Scholar]
- Chang, Y.-Y., van der Wel, A., da Cunha, E., & Rix, H.-W. 2015, ApJS, 219, 8 [NASA ADS] [CrossRef] [Google Scholar]
- Cid Fernandes, R., Stasińska, G., Schlickmann, M. S., et al. 2010, MNRAS, 403, 1036 [NASA ADS] [CrossRef] [Google Scholar]
- Comerón, S., Salo, H., Laurikainen, E., et al. 2014, A&A, 562, 121 [Google Scholar]
- de Vaucouleurs, G. 1959, Handbuch der Physik, 53, 275 [Google Scholar]
- Freeman, K. C. 1970, ApJ, 160, 767 [NASA ADS] [CrossRef] [Google Scholar]
- Ilyina, M. A., & Sil’chenko, O. K. 2011, Astron. Lett., 37, 589 [NASA ADS] [CrossRef] [Google Scholar]
- Kennicutt, R. C., Jr 1998, ApJ, 498, 541 [NASA ADS] [CrossRef] [Google Scholar]
- Kauffmann, G., Heckman, T. M., Tremonti, Ch., et al. 2003, MNRAS, 346, 1055 [Google Scholar]
- Kewley, L. J., & Ellison, S. L. 2008, ApJ, 681, 1183 [NASA ADS] [CrossRef] [Google Scholar]
- Kewley, L. J., Dopita, M. A., Sutherland, R. S., Heisler, C. A., & Trevena, J. 2001, ApJ, 556, 121 [Google Scholar]
- Kim, H.-S., Cho, J., Sharples, R. M., et al. 2016, ApJS, 227, 24 [CrossRef] [Google Scholar]
- Kormendy, J. 1984, ApJ, 286, 116 [NASA ADS] [CrossRef] [Google Scholar]
- Kostyuk, I. P. 1975, Soobscheniya Spets. Astrofiz. Obs., 13, 45 . [in Russian] [NASA ADS] [Google Scholar]
- Kostiuk, I. P., & Sil’chenko, O. K. 2015, Astrophys. Bull., 70, 280 [NASA ADS] [CrossRef] [Google Scholar]
- Kostyuk, I. P., Karachentsev, I. D., & Kopylov, A. I. 1981, Sov. Astron. Lett., 7, 148 [NASA ADS] [Google Scholar]
- Laurikainen, E., Salo, H., Buta, R., & Knapen, J. H. 2009, ApJ, 692, L34 [NASA ADS] [CrossRef] [Google Scholar]
- Laurikainen, E., Salo, H., Buta, R., & Knapen, J. H. 2011, MNRAS, 418, 1452 [NASA ADS] [CrossRef] [Google Scholar]
- Marino, R. A., Rosales-Ortega, F. F., Sánchez, S. F., et al. 2013, A&A, 559, A114 [NASA ADS] [CrossRef] [EDP Sciences] [Google Scholar]
- Matteucci, F. 1994, A&A, 288, 57 [NASA ADS] [Google Scholar]
- Matteucci, F., & Greggio, L. 1986, A&A, 154, 279 [NASA ADS] [Google Scholar]
- Pettini, M., & Pagel, B. E. J. 2004, MNRAS, 348, L59 [NASA ADS] [CrossRef] [Google Scholar]
- Proshina, I., Sil’chenko, O., & Moiseev, A. 2020, A&A, 634, A102 [CrossRef] [EDP Sciences] [Google Scholar]
- Sil’chenko, O., Kostiuk, I., Burenkov, A., & Parul, H. 2018, A&A, 620, L7 [NASA ADS] [CrossRef] [EDP Sciences] [Google Scholar]
- Sil’chenko, O. K., Moiseev, A. V., & Egorov, O. V. 2019, ApJS, 244, 6 [NASA ADS] [CrossRef] [Google Scholar]
- Thomas, D., Maraston, C., & Bender, R. 2003, MNRAS, 339, 897 [NASA ADS] [CrossRef] [Google Scholar]
- van de Voort, F., Davis, T. A., Matsushita, S., et al. 2018, MNRAS, 476, 122 [NASA ADS] [CrossRef] [Google Scholar]
- Wang, J., Kauffmann, G., Józsa, G. I. G., et al. 2013, MNRAS, 433, 270 [NASA ADS] [CrossRef] [Google Scholar]
- Zahid, H. J., Dima, G. I., Kudritzki, R.-P., et al. 2014, ApJ, 791, 130 [NASA ADS] [CrossRef] [Google Scholar]
All Figures
|
Fig. 1. All maps available for UGC 5936. Upper row: combined continuum-band optical image from the SDSS, r-band unsharp-masked image from the SDSS, and (g − r) colour image. Lower row: GALEX NUV image, 2MASS J-band image, and WISE/W3 12 μm band image. |
| In the text | |
|
Fig. 2. Results of the photometric analysis of the SDSS/DR9 data. The right plot presents the derived surface-brightness radial profile, and the blue dashed line is a fitted exponential law showing the area of disc domination in UGC 5936. |
| In the text | |
|
Fig. 3. Line-of-sight velocity profiles for the ionised gas and stars and the stellar velocity dispersion profile in UGC 5936 along its major axis. The stars show the stellar component; the different red signs relate to multiple emission lines of the ionised gas. The vertical shaded lanes designate different structure components of the galaxy labelled in the left panel. |
| In the text | |
|
Fig. 4. Lick index-index diagrams for UGC 5936. The left plot presents Mgb versus iron index diagram for the UGC 5936 structure components in comparison with the models by Thomas et al. (2003) for multiple Mg/Fe ratios. In the Hβ Lick index versus a combined metallicity Lick index diagram (right plot), five age sequences (red lines) are plotted as a reference frame; the blue lines crossing the model age sequences indicate the metallicities of +0.67, +0.35, 0.00, –0.33 from right to left. A large black star corresponds to the central core, and then the measurements are shown through the galaxy structure components: R = 4″ − 10″(pseudobulge), R = 10″ − 20″(lens), and R = 20″ − 40″(disc). A few globular clusters from Kim et al. (2016) belonging to the Galactic bulge and thick disc are also plotted to delineate the empirical old-age sequence for the metallicities below [Z/H] = − 0.4. |
| In the text | |
|
Fig. 5. Diagnostic diagrams for gas excitation determination. The classical BPT (Baldwin et al. 1981) diagram is shown in the left plot and an advanced version proposed by Cid Fernandes et al. (2010), including the Hα emission-line equivalent width, is shown in the right plot. The bordering lines between young star excitation, to the left of these lines, and the other mechanisms are those from Kewley et al. (2001; green dashed line) and from (Kauffmann et al. 2003; red dotted line). The black points represent the various parts of the UGC 5936 ring; the black star is the measurement of the south-eastern dwarf satellite. |
| In the text | |
Current usage metrics show cumulative count of Article Views (full-text article views including HTML views, PDF and ePub downloads, according to the available data) and Abstracts Views on Vision4Press platform.
Data correspond to usage on the plateform after 2015. The current usage metrics is available 48-96 hours after online publication and is updated daily on week days.
Initial download of the metrics may take a while.