Fig. 4.
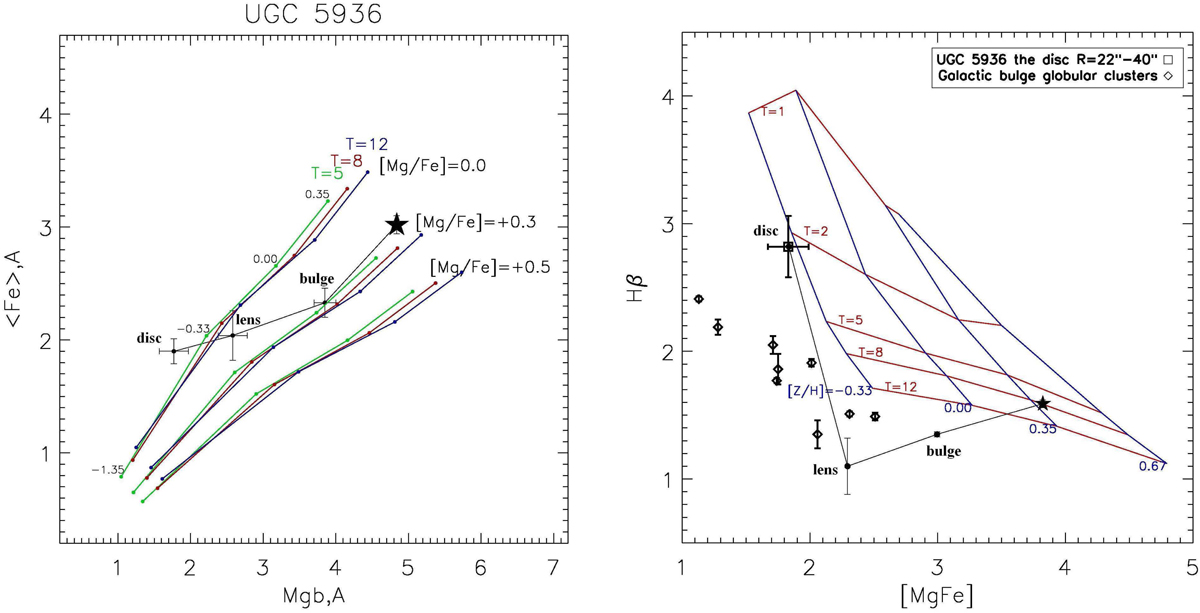
Lick index-index diagrams for UGC 5936. The left plot presents Mgb versus iron index diagram for the UGC 5936 structure components in comparison with the models by Thomas et al. (2003) for multiple Mg/Fe ratios. In the Hβ Lick index versus a combined metallicity Lick index diagram (right plot), five age sequences (red lines) are plotted as a reference frame; the blue lines crossing the model age sequences indicate the metallicities of +0.67, +0.35, 0.00, –0.33 from right to left. A large black star corresponds to the central core, and then the measurements are shown through the galaxy structure components: R = 4″ − 10″(pseudobulge), R = 10″ − 20″(lens), and R = 20″ − 40″(disc). A few globular clusters from Kim et al. (2016) belonging to the Galactic bulge and thick disc are also plotted to delineate the empirical old-age sequence for the metallicities below [Z/H] = − 0.4.
Current usage metrics show cumulative count of Article Views (full-text article views including HTML views, PDF and ePub downloads, according to the available data) and Abstracts Views on Vision4Press platform.
Data correspond to usage on the plateform after 2015. The current usage metrics is available 48-96 hours after online publication and is updated daily on week days.
Initial download of the metrics may take a while.