Fig. 5.
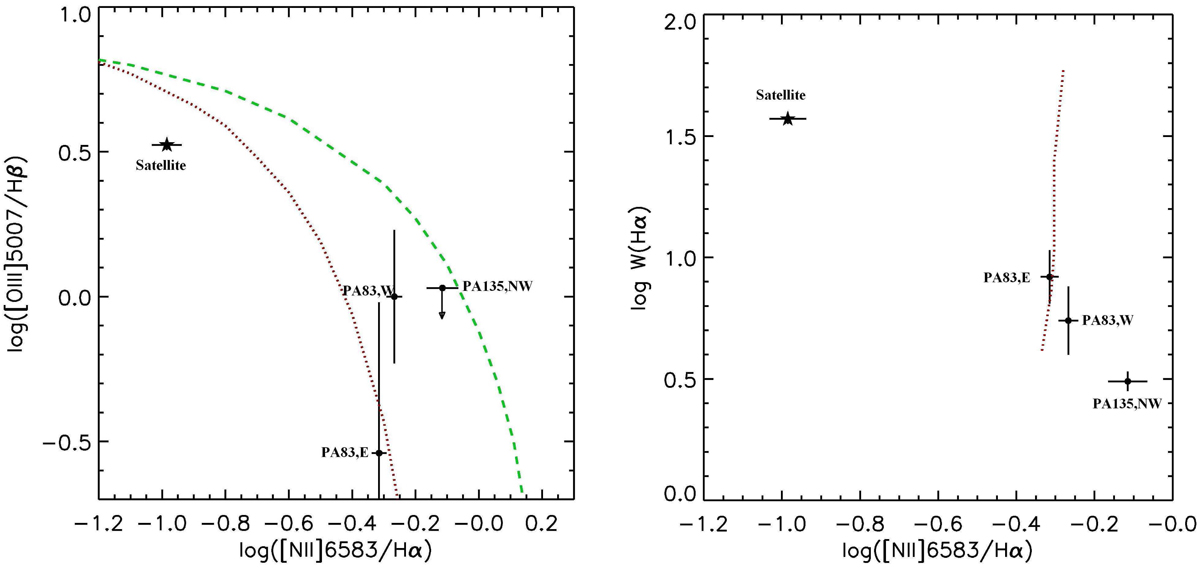
Diagnostic diagrams for gas excitation determination. The classical BPT (Baldwin et al. 1981) diagram is shown in the left plot and an advanced version proposed by Cid Fernandes et al. (2010), including the Hα emission-line equivalent width, is shown in the right plot. The bordering lines between young star excitation, to the left of these lines, and the other mechanisms are those from Kewley et al. (2001; green dashed line) and from (Kauffmann et al. 2003; red dotted line). The black points represent the various parts of the UGC 5936 ring; the black star is the measurement of the south-eastern dwarf satellite.
Current usage metrics show cumulative count of Article Views (full-text article views including HTML views, PDF and ePub downloads, according to the available data) and Abstracts Views on Vision4Press platform.
Data correspond to usage on the plateform after 2015. The current usage metrics is available 48-96 hours after online publication and is updated daily on week days.
Initial download of the metrics may take a while.