Fig. 9.
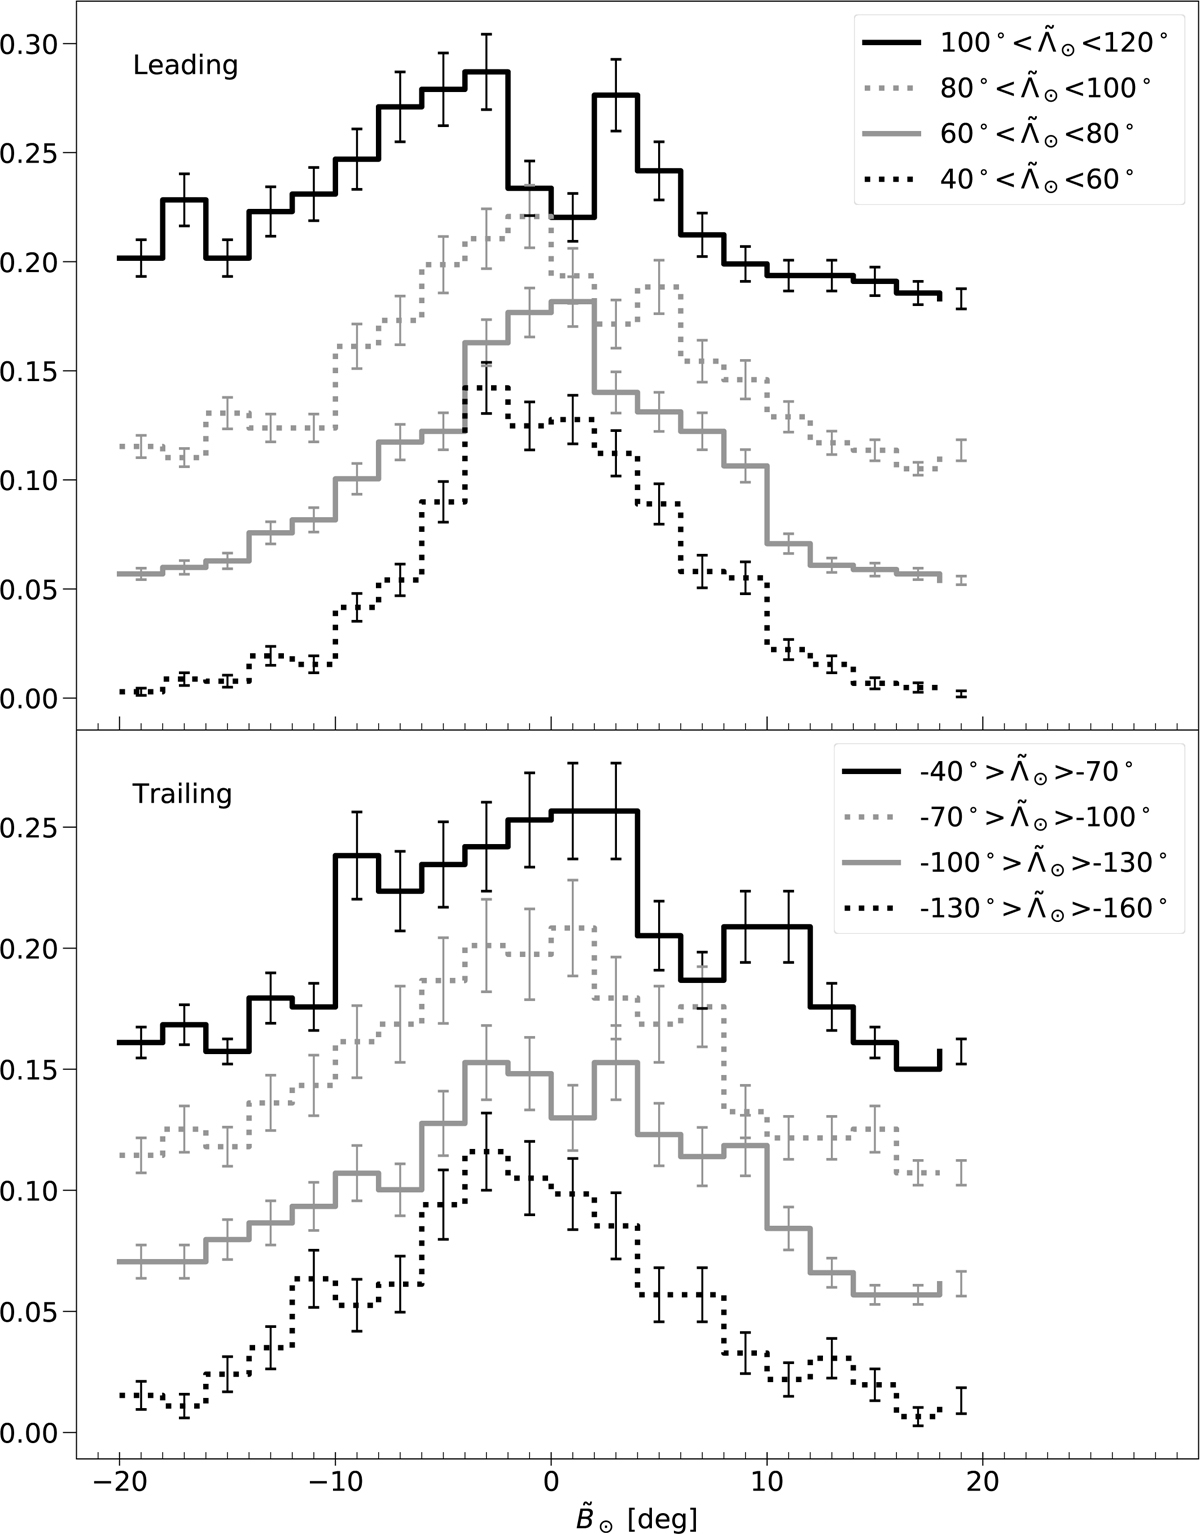
Histograms of ![]() normalised to the number count for different bins of
normalised to the number count for different bins of ![]() for the Strip final sample. Top: bins in the leading arm. Bottom: bins in the trailing arm. We have added an arbitrary offset in the y-axis to each curve for visualisation purposes.
for the Strip final sample. Top: bins in the leading arm. Bottom: bins in the trailing arm. We have added an arbitrary offset in the y-axis to each curve for visualisation purposes.
Current usage metrics show cumulative count of Article Views (full-text article views including HTML views, PDF and ePub downloads, according to the available data) and Abstracts Views on Vision4Press platform.
Data correspond to usage on the plateform after 2015. The current usage metrics is available 48-96 hours after online publication and is updated daily on week days.
Initial download of the metrics may take a while.