| Issue |
A&A
Volume 626, June 2019
|
|
|---|---|---|
| Article Number | A112 | |
| Number of page(s) | 9 | |
| Section | Catalogs and data | |
| DOI | https://doi.org/10.1051/0004-6361/201834089 | |
| Published online | 20 June 2019 | |
A catalogue of oxygen-rich pulsating giants in the Galactic halo and the Sagittarius stream⋆
1
Université de Montpellier, Laboratoire Univers et Particules de Montpellier CNRS/UM, Place Bataillon, 34095 Montpellier, France
e-mail: This email address is being protected from spambots. You need JavaScript enabled to view it.
2
Observatoire des Ifs, 6 impasse des Ifs, 84000 Avignon, France
3
18 Market Square, Northampton NN1 2DL, UK
Received:
14
August
2018
Accepted:
27
March
2019
Abstract
To construct a catalogue of oxygen-rich (M) asymptotic giant branch (AGB) stars in the halo, complementing the catalogues of carbon-rich (C) stars, previous lists of Miras and SRa semi-regulars located in the northern hemisphere are merged and cleaned of various defects. After putting aside known C stars, characteristics such as colours and periods indicate that most of the remaining objects are M stars. Distances are obtained through the period-luminosity relation. By considering their position in the sky, stars lying at |Z| > 5 kpc are confirmed to be in majority in the Sgr tidal arms. The M stars are more numerous than C ones. Our distance scale is supported by two cool variables located in the Pal 4 globular cluster. Along the Sgr arms, there is reasonable agreement on distances of our objects with recent RR Lyrae distances. A few stars may be as distant as 150 kpc, with possibly four at the trailing arm apocentre, and two in the A16 sub-structure, angularly close to two C stars. Ninety radial velocities are collected from Gaia and other sources. A catalogue with 417 M pulsating AGB stars is provided. This catalogue contains ∼260 stars in the halo with |Z| > 5 kpc. Their Ks magnitudes range from 8 up to 13. For comparison, the catalogue also provides ∼150 stars in the disc having 5 < Ks < 8.
Key words: Galaxy: halo / Galaxy: stellar content / stars: AGB and post-AGB
Full Table 3 is only available at the CDS via anonymous ftp to cdsarc.u-strasbg.fr (130.79.128.5) or via http://cdsarc.u-strasbg.fr/viz-bin/qcat?J/A+A/626/A112
© N. Mauron et al. 2019
 Open Access article, published by EDP Sciences, under the terms of the Creative Commons Attribution License (http://creativecommons.org/licenses/by/4.0), which permits unrestricted use, distribution, and reproduction in any medium, provided the original work is properly cited.
1. Introduction
Stars evolving on the asymptotic giant branch (AGB) can be either oxygen-rich (M), or carbon-rich (C). The general properties of AGB stars are reasonably understood and summarised in the book of Habing & Olofsson (2004). Much previous research concerning Mira variables enabled a greatly improved knowledge of the main components of the Galaxy (bulge, disc, bar, etc). For example, by considering Mira stars close to the Sun, their locations and their kinematics, Feast & Whitelock (2000) could detect the extension of the Galactic bulge bar in the solar vicinity and beyond. In a galaxy, the presence of AGB C stars is generally interpreted as indicating that an intermediate-age population exists. In contrast, the M AGB stars may be much older since one finds them in globular clusters. The goal of this work is to achieve a catalogue of the M AGB population of the Galactic halo, and we restrict this research to the Mira-type and SRa-type variable stars. In this paper, we name these periodic stars MSRa stars. Also, although this paper is devoted to M stars, we make a detailed comparison with C stars at several points to highlight differences and similarities.
In comparison with the Galactic disc, the understanding of AGB stars located in the halo has to be improved. A great deal of research has been carried out on C stars because their very red colour, or their peculiar spectra makes it easier to discover them; see Huxor & Grebel (2015; hereafter HG2015) for a synthesis. However, in comparison to C stars, relatively little attention has been devoted specifically to finding M stars. The fact that they can be found in globular clusters suggests that there may be such a population in the halo, but, to our knowledge, a systematic census is missing.
One of the difficulties in finding M AGB stars at high Galactic latitude is to separate them from the large amount of dwarfs in the disc. Infrared properties and/or variability may be thought as useful methods. One of the early studies of these M stars was based on the availability of the infrared IRAS data. Indeed, a complete survey of M Miras with short or intermediate period and with |b| > 30° is due to Jura & Kleinman (1992), but distances to the Galactic plane (Z) are mostly less than 3 kpc. More precisely, of a total of 318 objects, only 13 have |Z| > 3 kpc. Another interesting work is that of Whitelock et al. (1994, 1995). To investigate cases of very high-mass loss AGB stars, they choose them in the south Galactic Cap at b < −30° and select those that have IRAS fluxes and colours. Because fluxes at 12 μm and 25 μm are needed, these sources are not very distant: their time-averaged magnitude is typically K < 7, with |Z| < 4 kpc. Finally, Gigoyan & Mickaelian (2012) published a list of M stars (dwarfs or giants or AGB stars) found by eye-scanning the Byurakan objective-prism plates. We have cross-matched their sample with the General Catalogue of Variable Stars (Samus et al. 2017) and 85 Miras are identified. However, their Ks magnitudes are less than seven because the Byurakan plates are not deep.
This situation has changed with large-scale experiments searching for variable objects over all the sky. A first catalogue of periodic giants based on the LINEAR experiment was published by Palaversa et al. (2013). It covers 10 000 square degrees and reaches rSDSS = 18. A second catalogue is by Drake et al. (2009, 2014), from the Catalina experiment, covering over 20 000 square degrees down to V ∼ 19. In addition to yielding a number of new results on variable objects in general, these databases dramatically increase the number of known MSRa out of the Milky Way plane. From their Catalina sample of ∼500 MSRa, Drake et al. (2014) show that some of these trace the Sgr stream. We decided to reanalyse their data for several reasons. First, we intend to build a catalogue of M stars in the halo, as a complement to the HG2015 compilation of C stars. Second, in order to determine distances and since periods are provided, we use the K-band period-luminosity relation instead of an absolute magnitude Mv ∼ −3 adopted by Drake et al. (2014). Third, the Sgr arms have been mapped recently in detail with RR Lyr variables from the PanSTARRS data, providing accurate distances to which those of MSRa stars can be compared (Sesar et al. 2017; Hernitschek et al. 2017). Finally, we wish to investigate the possible existence of very distant stars, at more than ∼70 kpc from the Sun.
In Sect. 2, we construct a preliminary list of MSRa stars from catalogues mentioned above, pay attention to a variety of flaws and obtain a sample of 417 stars. In Sect. 3, we focus on their properties, in particular those independant of the distances: we have examined their colours, (peak-to-peak) V-band amplitudes, periods, apparent positions and how to best attribute a pulsation mode through consideration of photometric colours. In Sect. 4, we describe and discuss the results. We also derive distances and their uncertainties. It is found that the number of M stars in the halo from our sample is richer by a factor of ≈3 than the presently known sample of halo C stars. A few remarkable stars are discussed. Our catalogue of M stars is presented, and includes 90 radial velocities. Finally, we give our conclusions in Sect. 5.
2. Building the sample
To build a preliminary list of MSRas, first we considered the catalogue of Drake et al. (2014). We note that this catalogue is based on the Data Release 1 (DR1) of Catalina, and that supplementary monitoring data are provided in the DR2, which is usable on the Catalina web site. We added the MSRa stars contained in the catalogue of Palaversa et al. (2013). We also added the C stars, periodic or irregular, compiled by HG2015, as well as other C stars that are warmer, but may have been missed as pulsators in previous studies. Finally, we examined stars that had been found as contaminants in our survey for C stars. After checking their light curves on the Catalina DR2 database, those which were periodic were included.
Because the LINEAR or Catalina coordinates have an accuracy of ∼3″, we cross-correlated our list with the 2MASS catalogue with a search radius of 5″. Objects lacking a 2MASS counterpart were rejected. In rare cases, it may be that more than one 2MASS source is found. Generally, there is one bright source and the others are much fainter. In such cases, consideration of magnitudes allows us to identify the true counterpart. However, when the choice is not obvious, the object was dropped.
This first 2MASS cross-matching procedure leads to a list of 894 entries. Further cleaning is necessary for many reasons. Numerous objects are common to Drake’s and Palaversa’s catalogues, and there are 112 duplicates in our preliminary list. These duplicates are, however, interesting as they can inform us about differences in amplitudes and periods provided by the two databases. There are also objects presented in the LINEAR or Catalina catalogues as being periodic variables, but a systematic examination of Catalina light curves shows them to be of poor quality, almost constant, or not clearly periodic. These objects were rejected, as well as those that are saturated. We also rejected objects with Ks < 5 in the 2MASS catalogue, because they are too close to us, but we keep many disc stars with typically Ks ∼ 5−7, in order to be able to compare halo and disc properties.
Occasionally, a periodic light curve displays a significant amplitude variation (∼30%). Although this may happen for AGB stars (see below), another possibility is that the star is a still unknown, slowly rotating, spotted giant. In the Galactic bulge, the overwhelming majority of these variables have periods less than 100 days (Drake 2006). To our knowledge, no similar information exists for the thick disc or halo giant populations. This limit of 100 days is smaller than the periods of most of the stars studied in this work. In these occasional cases we chose not to be too conservative at this stage, and we kept these rare cases in our list. An additional reason for doing so is that supplementary observations could resolve this ambiguity. For example, spectra of red, variable members of 47 Tuc ([Fe/H] ∼ −1.5) display strong, variable Balmer emission lines that are explained with pulsation shocks (van Loon et al. 2007; their Fig. 21).
We also interrogated Simbad at CDS and found that two quasars are present in our list: one is at α = 26.13977 δ = 27.08419, and the other at α = 116.99665, δ = 20.87373, coordinates J2000 in degrees. As a consequence, we systematically looked for matches in the QSO-AGN catalogue of Véron-Cetty & Véron (2010; 168 940 entries), and the Sloan DR7 quasar catalogue (Schneider et al. 2010; 105 783 entries), but no supplementary cases were found.
Finally, a more intricate cleaning necessity appeared when we focused our attention on very distant stars, possibly located at more than ∼100 kpc. We discovered that many of these faint sources (Ks ∼ 12−14) with apparent periodic signals were, in fact, objects polluted by bright Miras located at less than 2′ away and with identical periods. A thorough search within 5′ for all our sources resulted into identifying nine cases, given in Table 1.
False very-faint variables.
To conclude, having achieved this cleaning procedure, 417 objects remained that are not known as being carbon rich. We refer to these 417 objects hereafter as our sample.
3. Analysis
Since this paper deals with the halo MSRa population, including the Sgr arms, and because we do not have a complete kinematic information for the majority of sources in our sample, we needed to consider a quantitative limit separating halo stars and those of the Sgr arms on one side, and a complementary group of objects from the disc, on the other side. After some tries, we found that a separation with the height Z (in kpc) from the Galactic plane works reasonably well, and that |Z| = 5 kpc is a good compromise. The quantity Z is derived by assuming all objects to obey the Ks-band period-luminosity relation with Wesenheit indices of Soszyński et al. (2007). A more detailed discussion of the determination of distances is done in Sect. 4.1. Taking Z smaller than 5 kpc (i.e. 2−3 kpc) retains too many disc sources which pollute the halo sub-sample. Adopting a height of ∼10 kpc is too large because, at least from the model of Law & Majewski (2010), the Sgr arms distance can be as close as 10 kpc from the Sun (see also Fig. 15 of HG2015). In the following, we present results concerning the colours, amplitudes, periods, and location in the sky. These are the best-determined characteristics because they do not involve distances.
3.1. Colours, amplitude and periods
In Fig. 1, we show three histograms of the (J − Ks)0 colour index. Correction for interstellar extinction is achieved with AJ = 0.87 E(B − V) and AKs = 0.35 E(B − V), from Cardelli et al. (1989), with E(B − V) from Schlegel et al. (1998). The upper panel displays C stars. Stars of our sample with |Z| > 5 kpc and |Z| < 5 kpc are shown in the middle and bottom panels, respectively. It can be seen that C stars are in very large majority redder than (J − Ks)0 ≈ 1.3, while an overwhelming proportion of our stars at |Z| > 5 kpc are bluer. This strongly suggests that these bluer stars are mostly oxygen-rich. The histogram ordinates are the number of objects per bin, and shows that the bluer sample is considerably richer than the C star sample, by a factor of ≈3. The (J − Ks)0 colours in the lowest panel suggest that the stars of our sample with |Z| < 5 kpc are in majority M stars, although a few C stars may be present.
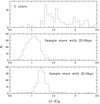 |
Fig. 1. Histogram of (J − K)0 of long-period variables. Top panel: halo C stars. Middle panel: stars in our sample for which the height |Z| from the Galactic plane is larger than 5 kpc. Lower panel: as middle panel, but |Z| < 5 kpc. We do not include irregular variables, with no well-defined periodicity (they are ignored in this paper) in any of the panels. |
Pulsation amplitudes deserve attention because they are involved in the uncertainty on distances. This is because distance determination is based on the use of Ks, but the phase of this Ks measurement is ignored. Therefore we attempted to estimate the range of variation in Ks by scaling optical amplitudes to the near-infrared. The LINEAR survey took place between 1998 and 2009, while the Catalina survey DR1 covers the period 2005−2011. Thus, an overlap of four years exists. Consequently, we expect that, in a first approximation, amplitudes given by the two experiments should agree. We note that Catalina amplitudes are derived from Fourier fits, while LINEAR amplitudes are the range of values between 5% and 95% in the signal distribution. Figure 2 displays one amplitude versus the other for common objects of our initial list. The agreement seems very reasonable, with σ = 0.21 mag. This scatter means that some amplitudes may change over years by at least this amount.
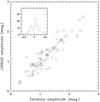 |
Fig. 2. Catalina versus LINEAR V-band amplitudes for common MSRa variables. The dotted line is a 1:1 line. The inset shows the histogram of residuals. The 1σ scatter is 0.21 mag. |
In Fig. 1, we saw that the halo sample stars (with |Z| > 5 kpc) are generally bluer than the halo C stars, although there are exceptions. Here, we have investigated whether a period-amplitude diagram would bring some complementary information. Figure 3, panel a, shows that these halo stars comprise a main population with P = 150−175 days, and a small population with low amplitude and longer periods. In contrast, panel b shows that the periods of C stars are more scattered over a 150−300 days interval, and do not include the large-period low-amplitude family. Therefore, a periodic AGB halo star with period P < 170 days is more probably of M type than of C type. This result is supported by an ongoing program of M/C classification of several hundreds of Catalina MSRa in both hemispheres (Gigoyan, priv. comm.). This program shows that, at least for V ≤ 16, only ∼3% are newly discovered C stars.
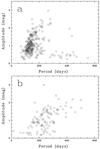 |
Fig. 3. Catalina amplitudes plotted as a function of pulsation periods for MSRa in the halo. All stars plotted here have |Z| > 5 kpc. Panel a: our sample stars obeying (J − Ks)0 < 1.3. Panel b: carbon stars. We note the large difference of these two distributions, strongly suggesting that most of the stars in the upper panel are not carbon rich. All stars plotted here have |Z| > 5 kpc. |
3.2. Apparent positions
In Fig. 4 (middle panel), we plot M stars verifying |b| > 20°, and |Z| > 5 kpc. With these selections, the disc members nearly vanish. Clearly, a very large number of these stars are located close to the sinusoid fitted on C stars. There are many more objects with right ascension (RA) between 0° and 80°, but the most numerous population is in the Sgr leading arm with RA between 160° and 250°.
 |
Fig. 4. Apparent positions of pulsating AGB stars in equatorial coordinates. Left panel: all known C stars that are periodic and have |Z| > 5 kpc. The sinusoid is an eye fit to the majority of these C stars. Middle panel: stars of our sample (M type) having |Z| > 5 kpc. Right panel: stars of our sample having |Z| < 5 kpc. Dashed lines indicate |b| = 20°. We note that M stars are more numerous than C stars along the Sgr arms. |
3.3. Separating C and C′ pulsating sequences
The MACHO and OGLE surveys (Alcock et al. 1997; Udalski et al. 1994) monitoring stars in the Large Magellanic Cloud (LMC) or the Galactic bulge have shown that MSRa stars pulsate in different modes. Several period-luminosity sequences exist, in particular the so-called sequence C for fundamental pulsation and sequence C′ for first overtone (Wood et al. 1999; Ita et al. 2004). Here, in order to avoid confusion with C (carbon) stars, we name seq-C, seq-C′, and seq-D the three P-L sequences considered in this work. In the Magellanic Clouds or the bulge, the sequence separation was made possible because all stars were at the same distance. In the case of stars in the halo or in the Sgr arms, this distance is unknown and has to be determined. For carbon stars, HG2015 based their classification seq-C or seq-C′ on three diagrams involving the (J − Ks)0 colour index, periods and amplitudes. Although, as they note, the diagram log(P) versus (J − Ks)0 presents some difficulties to determine this separation, they reach the conclusion that very few (5 of 121) are seq-C′ stars.
Concerning our sample stars, none of which are known C stars, we find that the clearest results are obtained by considering the (I − Ks)0 colour. We find this colour to be more efficient than (V − Ks)0 to separate sequences equally well for the LMC and the halo sample. Figure 5 shows the situation of LMC stars, for which sequences are known. Here, I is a time-averaged magnitude from OGLE and Ks is from the single epoch 2MASS survey. We draw a boundary between seq-C and seq-C′ populations. Figures 6 and 7 show the same diagrams for the stars of our sample, with |Z| > 5 kpc and |Z| < 5 kpc, respectively. The I-band photometry that we use is derived from the Catalina VCSS magnitude and the 2MASS J − Ks colour, as explained in the Appendix.
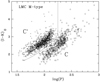 |
Fig. 5. (I − Ks)0 colour index versus period (in days) for oxygen-rich MSRa variables of the LMC. The curved line separating sequence C and C′ is y = ax2 + b where x = log(P)−1.2, a = 2.3, b = 1.45. The vertical line corresponds to P = 178 days. |
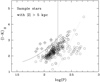 |
Fig. 6. (I − Ks)0 versus period (in days) for our sample stars located at more than 5 kpc from the Galactic plane. The curved line is the same as for LMC. Stars with an overplotted cross are attributed to sequence C′. Stars to the right of dotted line are considered to belong to sequence D. |
In Figs. 6 and 7, the plotted boundary lines are identical to those of the LMC. One could object that boundaries separating sequences might change with population characteristics, such as metallicity. Here, we have assumed that there is no change of these boundaries. The metallicity of many giant stars in the Sgr arms is close to that of the LMC, where [Fe/H] ≈ −0.5 on average. More precisely, observations of the metallicity distribution in the Sgr arms can be found in Monaco et al. (2007), Chou et al. (2007), and Carlin et al. (2018), among others. The distribution peaks at ∼ − 0.75 and has a lower metallicity component. Therefore, it seemed reasonable to us to keep boundaries unchanged, although we recognise that other factors, such as star formation history, could play a role. Certainly, our assumption deserves additional investigation.
In Fig. 6, most of our stars are to the right of the boundary. Six objects are clearly to the left, and we assign them to sequence C′. The position of about 20 objects, to the right of a dotted line, suggests that they are not members of sequence C. Comparing Figs. 6 and 7 shows that the main cloud shifts to the red and longer periods in Fig. 7. Since disc stars dominate the |Z| < 5 kpc population, one interpretation of this shift is that it arises from the higher metallicity of the disc as compared to the halo. In Fig. 7, we consider that only five stars are separated enough from the boundary line to be considered as being on the sequence C′. Three stars may lie on the D sequence.
The fact that so few stars are found in sequence C′ is puzzling, in strong contrast with what is seen in the LMC. We first note that exactly the same fact occurs for halo carbon stars, as found by HG2015. Additionally, the HG2015 method of separating sequences and our method are different, leading however to similar conclusions. HG2015 suggested that seq-C′ pulsators have amplitudes too small to be included in the Catalina MSRa catalogue of Drake et al. (2014). This may be true, although not entirely convincing because ∼15% of a total of 1200 LMC seq-C′ stars have a V-band amplitude larger than 0.55 mag in the OGLE catalogue. Such a large amplitude is relatively well detected by Catalina, a point that remains unexplained for us.
4. Results
4.1. Distances
After having determined the pulsation sequences for stars of our sample, we can derive their distances. For that purpose, we used, as HG2015 did for C stars, the near infrared Wesenheit magnitudes WJK. We used the P − WJK relations given in Table 1 of Soszyński et al. (2007) for O-rich sequences labelled CO, C′O and DO. We adopted m − M = 18.49 for the LMC distance (e.g. De Grijs et al. 2014).
The uncertainty on distances is comprised of: (a) the measurement error of the Ks 2MASS magnitude provided in the 2MASS catalogue, of order 0.03 mag; (b) the relative uncertainty on the period found to be ∼2%, from comparing periods given by LINEAR and those of Catalina, implying 0.04 mag on the absolute magnitude; (c) the scatter of the P-L relation, i.e. σ = 0.15 mag; and finally (d) the uncertainty that originates in the single epoch character of Ks. Ideally we should use a time-averaged Ks, but this quantity is lacking. This implies an uncertainty in relation with the Ks-band amplitude that we estimate as explained below.
For C stars, HG2015 exploit a correlation between the Ks amplitude and the (J − Ks)0 colour, established for dusty Miras with that colour lying between ∼1.5 and 5. They use an extrapolation to the bluer colour for many C stars. Our stars are M type, and almost none are as red as that. We adopted another approach based scaling the observed V-band amplitude ΔV. We compare this quantity with the difference between Ks from 2MASS and Ks from the DENIS survey (Epchtein et al. 1999). These surveys provide independent data taken at two different dates. DENIS and 2MASS have very similar K-band photometries: according to Carpenter (2001), Ks(DENIS) is smaller than Ks(2MASS), by ∼0.02 mag for the range of (J − Ks)0 of our stars. Therefore, we expect that, for a given ΔV, the Ks difference can reach the Ks amplitude (all along this work, amplitudes mean peak-to-peak amplitudes).
By cross-matching our sample with the DENIS catalogue and requesting Ks > 5 to avoid saturation results in 136 stars. Figure 8 shows this approach to work reasonably well. The average shift between the two photometries was found to be 0.05 mag. In Fig. 8, the error bars drawn in ordinates are derived from summing in quadrature the 2MASS and DENIS catalogue errors. On abcissa, the following errors, which we believe reasonable, were adopted: ±0.15 mag when ΔV = 2.5 mag down to ±0.05 mag if ΔV = 0.3. This plot shows that ΔKs ≈ 0.40 × ΔV. For example, when ΔV = 2 mag, Fig. 8 shows that the absolute value between the two Ks values can reach 0.8 mag.
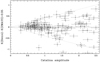 |
Fig. 8. Difference between KDENIS and K2MASS as a function of the Catalina amplitude for 136 stars of our sample obeying K2MASS > 5. This diagram suggests the K-band amplitude to be around 0.4× the V-band Catalina amplitude, as indicated by dotted lines. |
After including the ∼0.2 mag error discussed in Sect. 3.1, the last uncertainty term (called d above) can reach 0.5 × (0.4(ΔV + 0.2)) mag. Typically, ΔKs ∼ 0.1 mag for ΔV = 0.3, and ΔKs ∼ 0.4 mag for ΔV = 2. The two last uncertainties (named c and d above) dominate, and distances are derived to within 20% or better.
The derived distance can be large, up to 150 kpc. In Fig. 9, we plot the distances as a function of the longitude  in the plane of the Sgr orbit. Coordinates in this plane
  and
and  are derived from Appendix A of Belokurov et al. (2014). Here, we have considered objects that have
  . The continuous line traces the mean locus of RR Lyr stars as given by Hernitschek et al. (2017). The 1σ depth of the RR Lyrae location is about 4 kpc and 6 kpc for the leading and trailing arm, respectively. For the leading arm, there is reasonable agreement between RR Lyrae and M stars. For example, near
  and 90°, agreement is very good. However, for
  , many of our M stars are slightly farther away from us. Concerning the trailing arm, the distances are in agreement for 70% of the stars, but are larger (by up to 40%) for 30% of them. MMK-101 is at a distance suggesting it is member of a Sgr arm extension called “feature 2” in Sesar et al. (2017).
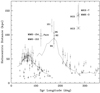 |
Fig. 9. Heliocentric distance as a function of the Sgr longitude. Only stars within 13° of the Sgr orbit plane are plotted. The continuous line is the average position of RR Lyr variables of the Sgr arms given by Hernitschek et al. (2017). The 1σ scatter of this RR Lyrae position is ∼5 kpc. The globular cluster Pal 4 is indicated by a triangle. Two carbon stars, HG5 and HG3, are plotted with asterisks. |
At  , we indicate two stars, MMK-153 and MMK-154, at distances 92 ± 18 kpc and 98 ± 13 kpc, respectively. Coordinates and some photometric information of stars discussed in the text are provided in Table 2. MMK-153 and MMK-154 belong to the globular cluster Pal 4 and were already known. According to Harris (1996, 2010 edition), this cluster is at 108 kpc, with a metallicity Fe/H = −1.41. At distances of 100 kpc, they represent excellent examples on which other stars can be compared. In particular, obtaining the Pal 4 distance within uncertainties for these two stars supports our method for distance determinations.
Coordinates (J2000) from 2MASS, de-redenned 2MASS Ks magnitudes, and periods (from Catalina) for MMK stars cited in the text.
In the upper right corner of Fig. 9, we have labelled MMK-003 and MMK-007, because they are among the most distant stars in our sample. They are angularly separated by only 5.7°. Interestingly, they are also close to two carbon stars, renamed HG3 and HG5 by HG2015. The former is at 2.6° from MMK-003, and the latter is at 6.5° from MMK-007. HG2015 attributed HG3 to the A16 halo sub-structure, while this was less sure for HG5. Given uncertainties, the distances of our M stars, 145 ± 20 kpc, are in remarkable agreement with those of the carbon stars, 114 ± 15 and 140 ± 22 kpc. The light curves of the eight more distant stars shown in Fig. 9 are given in Fig. 10. Periods are those given by the Catalina DR2 database. The two light curves plotted at bottom of Fig. 10 are MMK-153 and MMK-154, members of Pal 4.
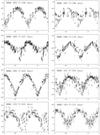 |
Fig. 10. Catalina magnitude as a function of phase, for labelled stars in Fig. 9. The light curves at bottom refer to two members of the Pal 4 globular cluster. |
4.2. A peculiar clump
When one looks at Fig. 4, middle panel, one can see that, south of this line, there exists a group of stars at RA ∼ 160°. This part of the sky is magnified in Fig. 11, where we plot M stars (circles), known C stars (filled circles), together with the two stars of pair 6 of Starkenburg et al. (2009). Crosses indicate those objects at more than 25 kpc. The three C stars are, from bottom to top, m7 (alias HG52), m36 (alias HG 48), and m04 (Mauron et al. 2004). M04 was missed in the census of HG2015. The distances and heliocentric radial velocities Vr of these three C stars are 40 kpc and +342 km s−1, 24 kpc and +306 km s−1, and 75 kpc and +202 km s−1, respectively. As noted by HG2015, the first of these three stars may have a link with the Starkenburg et al. stars located at 30 kpc with Vr = 380 km s−1. The other two C stars are isolated. We have also indicated the position of the Orphan stream which is well detected by a variety of methods (Grillmair 2006; Belokurov et al. 2006; Bernard et al. 2016) and is at a distance of ∼20 kpc. It is clear that our clump is not the Orphan stream. Radial velocities are necessary to confirm or deny the physical reality of this peculiar feature.
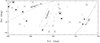 |
Fig. 11. Close-up on the region of the group of stars seen at RA ∼ 160°. M stars and C stars are plotted with open and filled circles, respectively. Two triangles at bottom are pair 6 of Starkenburg et al. (2009). Overplotted crosses are stars more distant than 25 kpc from the Sun. Those at the upper left corner belong to Sgr arm. The Orphan stream position is indicated. |
4.3. Gaia data
4.3.1. Parallaxes
In the Gaia DR2 (Gaia collaboration 2016), parallaxes are available for all the sample stars but two. However, half of them are negative and the positive ones have large uncertainties. In the whole sample, only seven stars have |ϵ(π)/π)| < 0.2. Therefore, it is necessary to wait for more robust Gaia measurements and future data releases in order to compare them to our distances based on period-luminosity relations.
4.3.2. Radial velocities
We first collected all Gaia radial velocities. We added those from the APOGEE (Majewski et al. 2017) and RAVE (Steinmetz et al. 2006; Kordopatis et al. 2013) surveys, and a few from Monaco et al. (2007). In most cases there is excellent agreement between them when two measurements are available, with differences of ≤2 km s−1. Our catalogue includes these velocities, their errors and references. Some additional velocities come from Feast & Whitelock (2000), and from Smak & Preston (1965), with errors ∼5 km s−1. Although less accurate, ∼12−15 km s−1, a few velocities come from the LAMOST database (Luo et al. 2016) or the Sloan DR7 M dwarf catalogue (West et al. 2011). Overall, of 429 stars on our catalogue, 90 have a radial velocity.
4.3.3. Proper motions
Gaia DR2 proper motions allow us to discard some distant stars, because these proper motions would imply an excessive tangential velocity (Vt) (we attributed a negative flag in our catalogue; see below). The relevant relation is Vt = 4.7 μ × D km s−1 with μ in mas yr−1 and D in kpc. To illustrate this point, two of the most distant stars in the Galaxy were found by Bochanski et al. (2014), namely ULAS J001535.72+015549.6 and ULAS J074417.48+25253233.0, at proposed distances of ∼275 kpc, and ∼240 kpc, with uncertainties of ∼70 kpc. These distances are based on the result that stars would be M-giants, and not dwarfs. Both are interestingly close to the Sgr mean orbit plane:  and
and  , for the first and second stars, respectively. While the second object has no significant Gaia proper motion, the first displays μα cos(δ) = −5.00 ± 1.11 mas yr−1 and μδ = −4.91 ± 0.82 mas yr−1. Were its distance of 240 kpc correct, it would yield a tangential velocity of ∼9000 km s−1. It seems to us more probable that it is a much closer dwarf star, although considerable care was dedicated by Bochanski et al. (2014) to spectroscopically discriminating giants and dwarfs.
Another very distant object was proposed by Mauron et al. (2018), named MMK-114 here, with Ks = 13.8 and (J − Ks)0 = 1.39, BSgr = −9.2°. The colour makes it unclear to classify it M or C. Its light curve (Fig. 12) is compatible with a semi-regular variable having a peak-to-peak amplitude of 0.6 mag. Catalina DR2 provides a tentative period of 297 days. Because it is faint, adopting this period would yield a distance of ∼200 kpc, putting it outside of the frame of Fig. 9. Gaia DR2 does not provide a significant parallax but gives μα cos(δ) = − 0.22 ± 0.26 mas yr−1 and μδ = −2.1 ± 0.19 mas yr−1. Provided this δ motion is confirmed, this star is closer than 200 kpc in order, again, to avoid excessively large velocity (∼2000 km s−1).
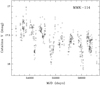 |
Fig. 12. Light curve of MMK-114 (see text). |
The stars MMK-003, MMK-007, MMK-101, MMK-153, MMK-154 have no significant proper motion. Those close to the apocentre of the trailing arm, MMK-92, MMK-094, MMK-101 have plausible Vt = 400, 240, and 270 km s−1 at their respective distances. We also checked the eight carbon stars listed by Deason et al. (2012, their Table 2), and found that only J1446-0055 displays some motion at more than 3σ: μα cos(δ) = − 1.00 ± 0.12 mas yr−1 and μδ = −0.53 ± 0.10 mas −1. At its distance of ∼80 kpc, this yields a plausible Vt = 425 km s−1.
4.4. The catalogue
Our catalogue includes the MMK number, α, δ (J2000), l and b, Sgr orbit coordinates  and
and  , E(B − V), (Ks)0, (J − Ks)0, absolute magnitude MKs, distance and its error in kpc, Z in kpc, period in days, Catalina amplitude and time-averaged magnitude VCSS, radial velocity, its uncertainty and the corresponding source, the Vr source, a quality and a corresponding comment, and finally the 2MASS and CRTS names when available. The first three lines of the catalogue are given in Table 3 in an abridged version for clarity.
Abridged version of the catalogue of M halo northern long period variables.
5. Conclusions
This work can be summarised as follows:
(1) By considering available literature on long-period variables out of the Galactic plane and at δ > −20°, our goal was to build a catalogue of AGB M stars located in the halo. This catalogue will make a northern complement to the census of C stars established by Huxor & Grebel (2015). After merging and cleaning available catalogues, a sample of 417 pulsating stars in the northern hemisphere is achieved, which includes no known C stars. Of these 417 stars, 262 are located at more than ∼5 kpc from the Galactic plane. Consideration of their (J − Ks)0 colour, periods, and amplitudes suggests that they are M stars.
(2) By selecting stars far away from the Galactic plane (|Z| > 5 kpc), one confirms a strong concentration along the apparent, orbital path of the Sgr tidal arms, especially on the leading arm. A major finding of this study is that there are about three times more M stars than C stars. This offers a future opportunity to investigate the Sgr AGB population in more detail and analyse it in a complementary way to C stars.
(3) The pulsation modes, needed for distance determination, are found with a diagram showing the (I − Ks)0 colour as a function of period, and by comparing it to that of the Large Magellanic Cloud. As for C stars, very few M stars are found to be on sequence C′. Then, near-infrared Wesenheit P-L relations established for LMC oxygen-rich AGB stars are adopted. Distances up to ∼150 kpc are derived, with typical relative uncertainties better than 20%. Two pulsating stars found in the Pal 4 globular cluster have correct distances of 100 kpc.
(4) If one considers stars located within 13° from the Sgr mean orbit plane, our distances for the leading arm agree very well with those recently derived with RR Lyr stars. Some of them are somewhat larger in the trailing arm. We find four stars located at the apocentre. Two stars are found to be close to two carbon stars in the A16 sub-structure at ∼150 kpc. There are seven stars angulary close to the Sgr orbit plane and more distant than 70 kpc. We also draw attention to a clump of M and C stars in the halo angularly close to the Orphan stream, but distinct of it. Radial velocities are required to check conclusions more rigorously in these cases.
(5) A catalogue of M AGB stars is presented. These stars belong to the thick disk, the halo, and the Sgr arms. Ninety radial velocities were collected from Gaia and other surveys like RAVE. Significant proper motions were used to check supposedly large distances, but few are discarded and flagged in the catalogue. Gaia DR2 parallaxes are presently too uncertain to achieve a robust comparison with our distances. The catalogue (Table 3) is available on Vizier at CDS, or on request. Further investigation of our sample with additional radial velocities and Gaia variability information will be presented in a future paper.
Acknowledgments
N.M. thanks our anonymous referee for remarks that greatly improved the manuscript. We also thank Olivier Richard for generous help, Henri Reboul and Denis Puy for encouragments, and the staff of LUPM for kind assistance. We thank Michael Feast, Patrick de Laverny and Nina Hernitschek for comments. N.M. is grateful to the Université de Montpellier for support. This work makes use of the Catalina database (California Institute of Technology, NASA), the Lincoln Near-Earth Asteroid Research LINEAR database (Massachusetts Institute of Technology Lincoln Laboratory, NASA and US Air Force), the Two Micron All Sky Survey (University of Massachusetts and IPAC/Caltech funded by NASA and NSF), the European infrared photometry DENIS experiment. We exploited the data of the European Space Agency mission Gaia processed by the Gaia Data Processing and Analysis Consortium, and the SIMBAD/Vizier facilities, offered by and operated at CDS, Strasbourg, France.
References
- Alcock, C., Allsman, R. A., Alves, D., et al. 1997, ApJ, 486, 607 [NASA ADS] [Google Scholar]
- Belokurov, V., Zucker, B. D., Evans, N. W., et al. 2006, MNRAS, 642, L137 [Google Scholar]
- Belokurov, V., Koposov, S. E., Evans, N. W., et al. 2014, MNRAS, 437, 116 [NASA ADS] [CrossRef] [Google Scholar]
- Bernard, E. J., Ferguson, A. M. N., Schlafly, E. F., et al. 2016, MNRAS, 463, 1759 [NASA ADS] [CrossRef] [Google Scholar]
- Bochanski, J. J., Willman, B. W., Caldwell, N., et al. 2014, ApJ, 790, L5 [NASA ADS] [CrossRef] [Google Scholar]
- Cardelli, J. A., Clayton, G. C., & Mathis, J. S. 1989, ApJ, 345, 245 [NASA ADS] [CrossRef] [Google Scholar]
- Carlin, J. L., Sheffield, A. A., Cunha, K., & Smith, V. V. 2018, ApJ, 859, L10 [NASA ADS] [CrossRef] [Google Scholar]
- Carpenter, J. M. 2001, AJ, 121, 2851 [NASA ADS] [CrossRef] [Google Scholar]
- Chou, M.-Y., Majewski, S. R., Cunha, K., et al. 2007, ApJ, 670, 346 [NASA ADS] [CrossRef] [Google Scholar]
- Deason, A. J., Belokurov, V., Evans, N. W., et al. 2012, MNRAS, 425, 2840 [NASA ADS] [CrossRef] [Google Scholar]
- De Grijs, R., Wicker, J. E., & Bono, G. 2014, AJ, 147, 122 [NASA ADS] [CrossRef] [Google Scholar]
- Drake, A. J. 2006, AJ, 131, 1044 [NASA ADS] [CrossRef] [Google Scholar]
- Drake, A. J., Djorgovski, S. G., Mahabal, A., et al. 2009, ApJ, 696, 870 [NASA ADS] [CrossRef] [MathSciNet] [Google Scholar]
- Drake, A. J., Graham, M. J., Djorgovski, S. G., et al. 2014, ApJS, 213, 9 [NASA ADS] [CrossRef] [Google Scholar]
- Epchtein, N., Deule, E., Derrière, S., et al. 1999, A&A, 349, 236 [Google Scholar]
- Feast, M., & Whitelock, P. 2000, MNRAS, 317, 460 [NASA ADS] [CrossRef] [Google Scholar]
- Gaia collaboration (Prusti, T., et al.) 2016, A&A, 595, A1 [NASA ADS] [CrossRef] [EDP Sciences] [Google Scholar]
- Gigoyan, K. S., & Mickaelian, A. M. 2012, MNRAS, 419, 3346 [NASA ADS] [CrossRef] [Google Scholar]
- Grillmair, C. J. 2006, ApJ, 645, L37 [NASA ADS] [CrossRef] [Google Scholar]
- Habing, H. J., & Olofsson, H. 2004, Asymptotic Giant Branch Stars (New York: Springer) [CrossRef] [Google Scholar]
- Harris, W. E. 1996, AJ, 112, 1487 [NASA ADS] [CrossRef] [Google Scholar]
- Hernitschek, N., Sesar, B., Rix, H.-W., et al. 2017, ApJ, 850, 96 [NASA ADS] [CrossRef] [Google Scholar]
- Huxor, A. P., & Grebel, E. K. 2015, MNRAS, 453, 2653 [NASA ADS] [CrossRef] [Google Scholar]
- Ita, Y., Tanabé, T., Matsunaga, N., et al. 2004, MNRAS, 347, 720 [NASA ADS] [CrossRef] [Google Scholar]
- Jura, M., & Kleinman, S. G. 1992, ApJS, 79, 105 [NASA ADS] [CrossRef] [Google Scholar]
- Kordopatis, G., Gilmore, G., Steinmetz, M., et al. 2013, AJ, 146, 134 [NASA ADS] [CrossRef] [Google Scholar]
- Law, D. R., & Majewski, S. R. 2010, ApJ, 714, 229 [NASA ADS] [CrossRef] [Google Scholar]
- Luo, A. L., Zhao, Y. H., Zhao, G., et al. 2016, VizieR Online Data Catalog: V/149 [Google Scholar]
- Majewski, S. R., Schiavon, R. P., Frinchaboy, P. M., et al. 2017, AJ, 154, 94 [NASA ADS] [CrossRef] [Google Scholar]
- Mauron, N., Azzopardi, M., Gigoyan, K., & Kendall, T. R. 2004, A&A, 418, 77 [NASA ADS] [CrossRef] [EDP Sciences] [Google Scholar]
- Mauron, N., Gigoyan, K., & Kostandyan, G. R. 2018, Astrophysics, 61, 10 [CrossRef] [Google Scholar]
- Monaco, L., Bellazzini, M., Bonifacio, P., et al. 2007, A&A, 464, 201 [NASA ADS] [CrossRef] [EDP Sciences] [Google Scholar]
- Palaversa, L., Ivezić, Z., Eyer, L., et al. 2013, AJ, 146, 10 [NASA ADS] [CrossRef] [Google Scholar]
- Samus, N. N., Kazarovets, E. V., Durlevitch, O. V., et al. 2017, Astron. Rep., 61, 80 [NASA ADS] [CrossRef] [Google Scholar]
- Schlegel, D. J., Finkbeiner, D. P., & Davis, M. 1998, ApJ, 500, 525 [NASA ADS] [CrossRef] [Google Scholar]
- Schneider, D. P., Richards, G. T., Hall, P. B., et al. 2010, AJ, 139, 2360 [NASA ADS] [CrossRef] [Google Scholar]
- Sesar, B., Hernitschek, N., Dierickx, M. I. P., et al. 2017, ApJ, 844, L4 [NASA ADS] [CrossRef] [Google Scholar]
- Smak, J. I., & Preston, G. W. 1965, ApJ, 142, 943 [NASA ADS] [CrossRef] [Google Scholar]
- Soszyński, I., Dziembowski, W. A., Udalski, A., et al. 2007, Acta Astron., 57, 201 [EDP Sciences] [Google Scholar]
- Starkenburg, E., Helmi, A., Morrison, H. L., et al. 2009, ApJ, 698, 597 [Google Scholar]
- Steinmetz, M., Zwitter, T., Siebert, A., et al. 2006, AJ, 132, 1645 [Google Scholar]
- Udalski, A., Szymanski, M., Stanek, K., et al. 1994, Acta Astron., 44, 165 [Google Scholar]
- van Loon, J Th, van Leeuwen, F., Smalley, B., et al. 2007, MNRAS, 382, 1353 [NASA ADS] [CrossRef] [Google Scholar]
- Véron-Cetty, M.-P., & Véron, P. 2010, A&A, 518, A10 [NASA ADS] [CrossRef] [EDP Sciences] [Google Scholar]
- West, A. A., Morgan, D. P., Bochanski, J., et al. 2011, AJ, 141, 97 [NASA ADS] [CrossRef] [Google Scholar]
- Whitelock, P., Menzies, J., Feast, M., et al. 1994, MNRAS, 267, 711 [NASA ADS] [CrossRef] [Google Scholar]
- Whitelock, P., Menzies, J., Feast, M., et al. 1995, MNRAS, 276, 219 [NASA ADS] [Google Scholar]
- Wood, P. R., Alcock, C., Allsman, R. A., et al. 1999, IAU Symp., 191, 151 [Google Scholar]
Appendix A: Estimation of the I-band photometry
The goal of this appendix is to describe how we estimated the I0-band time-averaged photometry of our sample, which is needed to separate sequence C and C′. From our sample of 417 stars, we identified a sub-sample of 96 stars with good quality I-band photometry from the DENIS catalogue (uncertainty on I < 0.2 mag, 90% of them with < 0.05 mag error). Then, the Catalina VCSS, the 2MASS J & Ks, and the DENIS I are corrected for interstellar extinction by adopting the colour excess from Schlegel et al. (1998). The used extinction law is from Cardelli et al. (1989), that is, AV = 3.107 E(B − V), AI = 1.705 E(B − V), AJ = 0.804 E(B − V), AK = 0.342 E(B − V). Finally, we searched for a function f((VCSS)0, J0, (Ks)0) that is as close as possible to the observed I0. We find that the best fit relation is:

This fit is found with N = 96 stars, with a scatter σ = 0.22 mag. Outliers at more than 2.2σ were removed. We checked that the residuals do not depend on color such as (VCSS − (Ks)0). These 96 stars have the following properties with 10.5 < (VCSS)0 < 17, 2.6 < (V − Ks)0 < 5.6, 0.75 < (J − Ks) < 1.4, E(B − V) < 0.3. These properties are obeyed by 80% of stars in our sample.
All Tables
Coordinates (J2000) from 2MASS, de-redenned 2MASS Ks magnitudes, and periods (from Catalina) for MMK stars cited in the text.
All Figures
|
Fig. 1. Histogram of (J − K)0 of long-period variables. Top panel: halo C stars. Middle panel: stars in our sample for which the height |Z| from the Galactic plane is larger than 5 kpc. Lower panel: as middle panel, but |Z| < 5 kpc. We do not include irregular variables, with no well-defined periodicity (they are ignored in this paper) in any of the panels. |
| In the text | |
|
Fig. 2. Catalina versus LINEAR V-band amplitudes for common MSRa variables. The dotted line is a 1:1 line. The inset shows the histogram of residuals. The 1σ scatter is 0.21 mag. |
| In the text | |
|
Fig. 3. Catalina amplitudes plotted as a function of pulsation periods for MSRa in the halo. All stars plotted here have |Z| > 5 kpc. Panel a: our sample stars obeying (J − Ks)0 < 1.3. Panel b: carbon stars. We note the large difference of these two distributions, strongly suggesting that most of the stars in the upper panel are not carbon rich. All stars plotted here have |Z| > 5 kpc. |
| In the text | |
|
Fig. 4. Apparent positions of pulsating AGB stars in equatorial coordinates. Left panel: all known C stars that are periodic and have |Z| > 5 kpc. The sinusoid is an eye fit to the majority of these C stars. Middle panel: stars of our sample (M type) having |Z| > 5 kpc. Right panel: stars of our sample having |Z| < 5 kpc. Dashed lines indicate |b| = 20°. We note that M stars are more numerous than C stars along the Sgr arms. |
| In the text | |
|
Fig. 5. (I − Ks)0 colour index versus period (in days) for oxygen-rich MSRa variables of the LMC. The curved line separating sequence C and C′ is y = ax2 + b where x = log(P)−1.2, a = 2.3, b = 1.45. The vertical line corresponds to P = 178 days. |
| In the text | |
|
Fig. 6. (I − Ks)0 versus period (in days) for our sample stars located at more than 5 kpc from the Galactic plane. The curved line is the same as for LMC. Stars with an overplotted cross are attributed to sequence C′. Stars to the right of dotted line are considered to belong to sequence D. |
| In the text | |
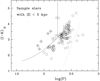 |
Fig. 7. Same as Fig. 6 for stars of our sample that are closer than 5 kpc from the Galactic plane. |
| In the text | |
|
Fig. 8. Difference between KDENIS and K2MASS as a function of the Catalina amplitude for 136 stars of our sample obeying K2MASS > 5. This diagram suggests the K-band amplitude to be around 0.4× the V-band Catalina amplitude, as indicated by dotted lines. |
| In the text | |
|
Fig. 9. Heliocentric distance as a function of the Sgr longitude. Only stars within 13° of the Sgr orbit plane are plotted. The continuous line is the average position of RR Lyr variables of the Sgr arms given by Hernitschek et al. (2017). The 1σ scatter of this RR Lyrae position is ∼5 kpc. The globular cluster Pal 4 is indicated by a triangle. Two carbon stars, HG5 and HG3, are plotted with asterisks. |
| In the text | |
|
Fig. 10. Catalina magnitude as a function of phase, for labelled stars in Fig. 9. The light curves at bottom refer to two members of the Pal 4 globular cluster. |
| In the text | |
|
Fig. 11. Close-up on the region of the group of stars seen at RA ∼ 160°. M stars and C stars are plotted with open and filled circles, respectively. Two triangles at bottom are pair 6 of Starkenburg et al. (2009). Overplotted crosses are stars more distant than 25 kpc from the Sun. Those at the upper left corner belong to Sgr arm. The Orphan stream position is indicated. |
| In the text | |
|
Fig. 12. Light curve of MMK-114 (see text). |
| In the text | |
Current usage metrics show cumulative count of Article Views (full-text article views including HTML views, PDF and ePub downloads, according to the available data) and Abstracts Views on Vision4Press platform.
Data correspond to usage on the plateform after 2015. The current usage metrics is available 48-96 hours after online publication and is updated daily on week days.
Initial download of the metrics may take a while.