Fig. 3.
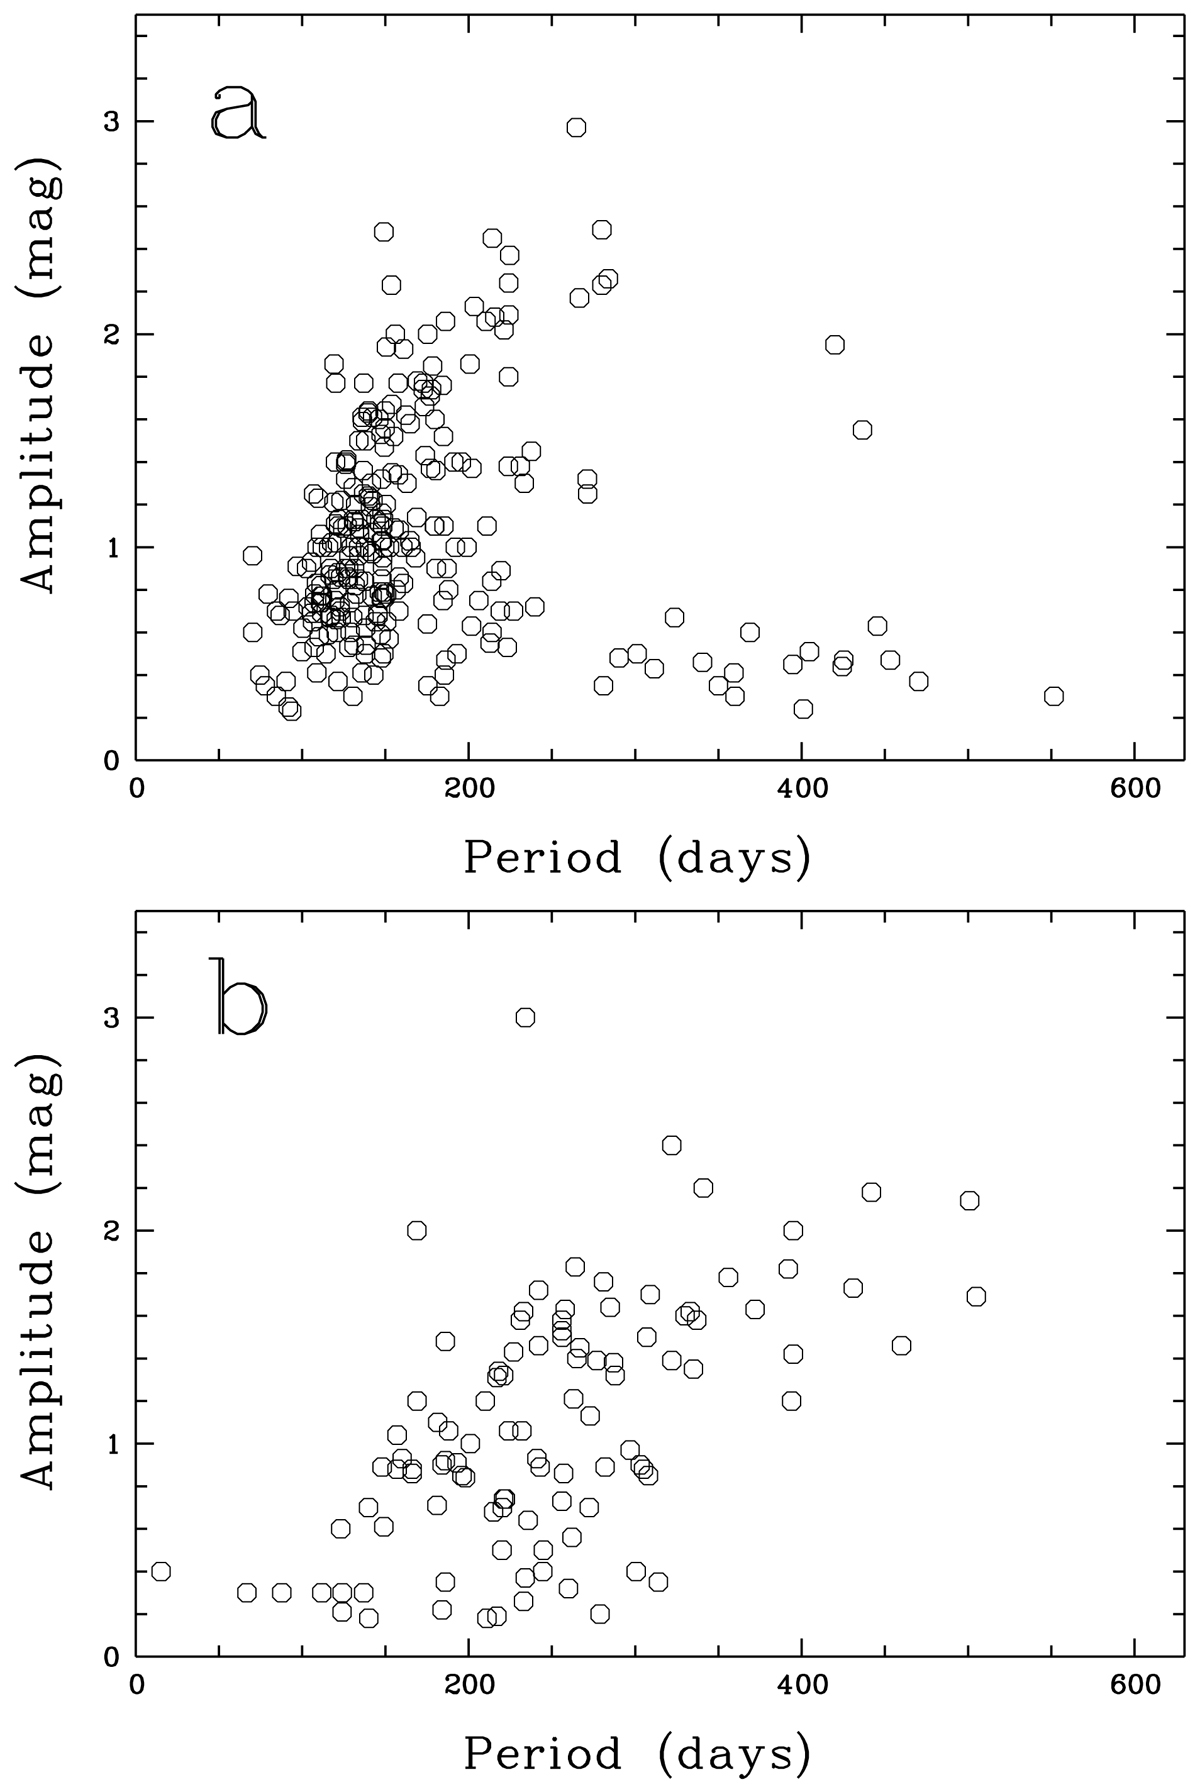
Catalina amplitudes plotted as a function of pulsation periods for MSRa in the halo. All stars plotted here have |Z| > 5 kpc. Panel a: our sample stars obeying (J − Ks)0 < 1.3. Panel b: carbon stars. We note the large difference of these two distributions, strongly suggesting that most of the stars in the upper panel are not carbon rich. All stars plotted here have |Z| > 5 kpc.
Current usage metrics show cumulative count of Article Views (full-text article views including HTML views, PDF and ePub downloads, according to the available data) and Abstracts Views on Vision4Press platform.
Data correspond to usage on the plateform after 2015. The current usage metrics is available 48-96 hours after online publication and is updated daily on week days.
Initial download of the metrics may take a while.