Fig. 7.
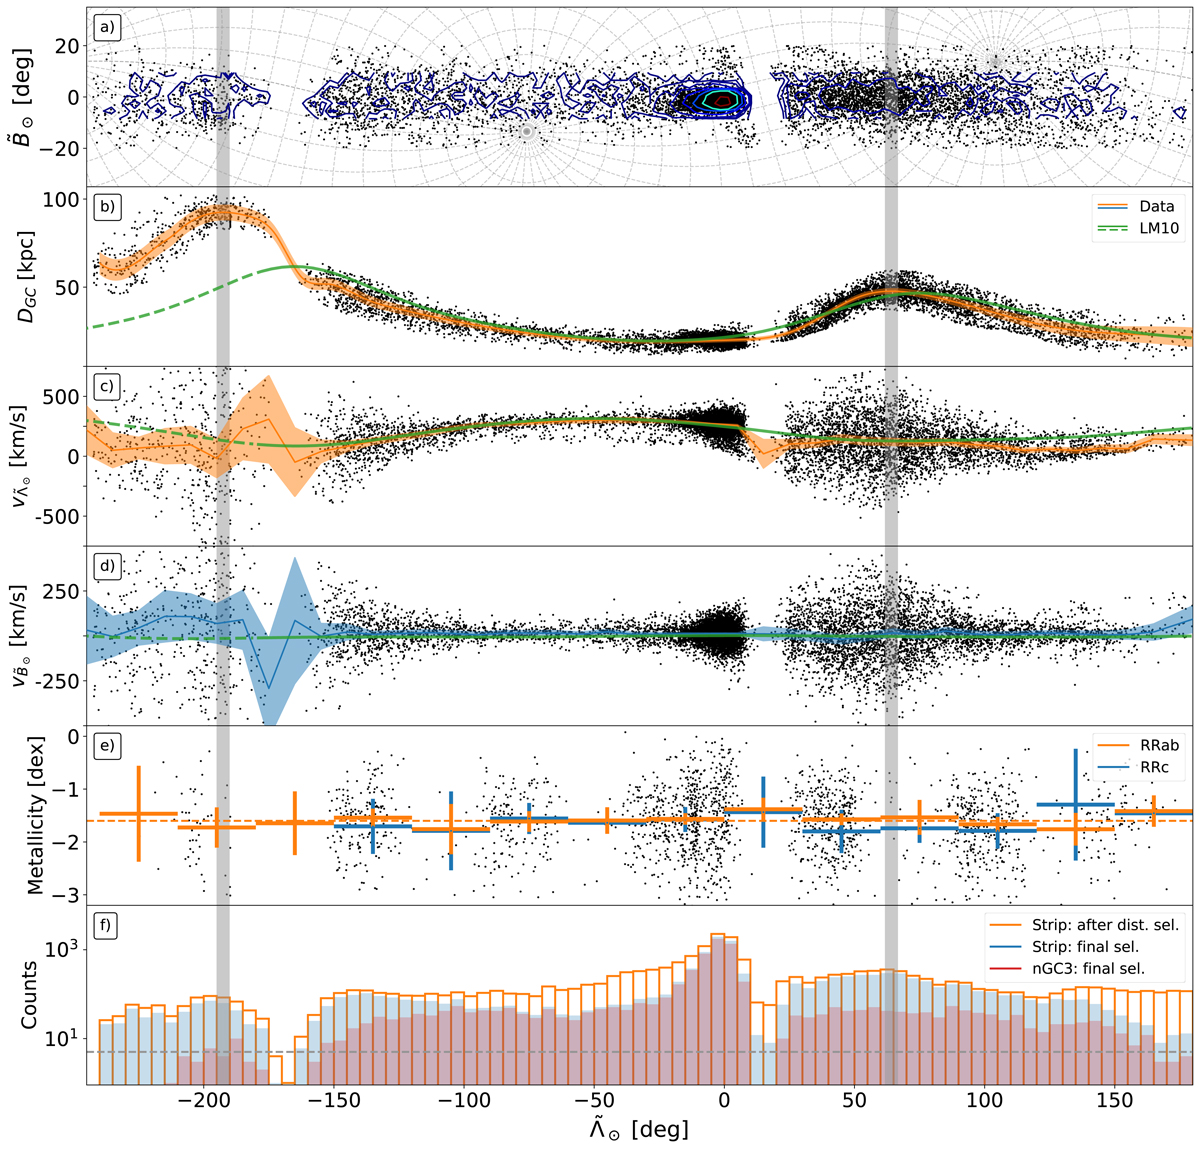
Position, distance, and velocity as a function of ![]() of the Sgr stream (Strip sample). (a) Sky distribution with overlaid count contours. The dashed lines represents a regular grid in the Galactic coordinate frame. (b) Smoothed median (orange line) and associated uncertainty (orange area) of the Galactocentric distance for the data (black dots) and LM10 (green line). (c–d) Same as (b) but for the velocity in the
of the Sgr stream (Strip sample). (a) Sky distribution with overlaid count contours. The dashed lines represents a regular grid in the Galactic coordinate frame. (b) Smoothed median (orange line) and associated uncertainty (orange area) of the Galactocentric distance for the data (black dots) and LM10 (green line). (c–d) Same as (b) but for the velocity in the ![]() (orange) and
(orange) and ![]() (blue) directions after correcting for the solar reflex. (e) Median metallicity of the RR Lyrae types AB (orange) and C (blue). (f) Histograms of
(blue) directions after correcting for the solar reflex. (e) Median metallicity of the RR Lyrae types AB (orange) and C (blue). (f) Histograms of ![]() for the Strip sample – but only after selecting by distance – (orange), for the final Strip sample (blue) and for the nGC3 sample (red). The dashed black line represents the threshold below which we do not compute the median used in the other panels. We also show the positions of the apocentres as two vertical grey stripes (see text).
for the Strip sample – but only after selecting by distance – (orange), for the final Strip sample (blue) and for the nGC3 sample (red). The dashed black line represents the threshold below which we do not compute the median used in the other panels. We also show the positions of the apocentres as two vertical grey stripes (see text).
Current usage metrics show cumulative count of Article Views (full-text article views including HTML views, PDF and ePub downloads, according to the available data) and Abstracts Views on Vision4Press platform.
Data correspond to usage on the plateform after 2015. The current usage metrics is available 48-96 hours after online publication and is updated daily on week days.
Initial download of the metrics may take a while.