Fig. 4.
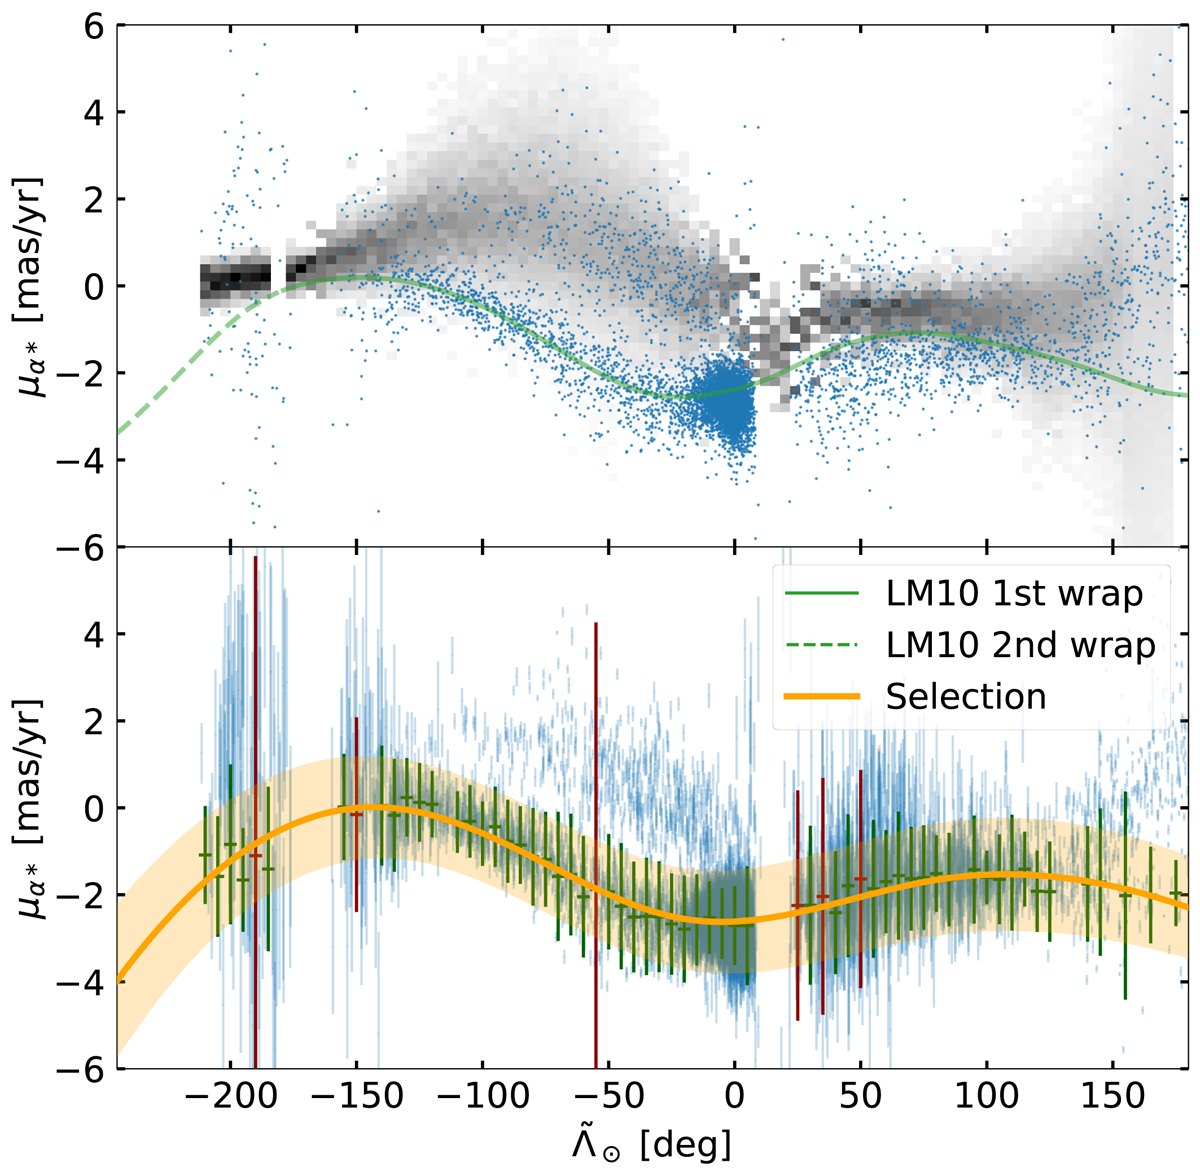
![]() against proper motion in right ascension of the Sgr stream. Top: all stars selected by distance superimposed on the histogram obtained from the mock catalogue (see text). Bottom: result of the TGM (green and red error bars) and the area that we use to further filter out the contamination (orange). Here we also show the prediction of the LM10 model with green lines. The stars at the trailing apocentre have been moved to the left of the plot by subtracting −360°.
against proper motion in right ascension of the Sgr stream. Top: all stars selected by distance superimposed on the histogram obtained from the mock catalogue (see text). Bottom: result of the TGM (green and red error bars) and the area that we use to further filter out the contamination (orange). Here we also show the prediction of the LM10 model with green lines. The stars at the trailing apocentre have been moved to the left of the plot by subtracting −360°.
Current usage metrics show cumulative count of Article Views (full-text article views including HTML views, PDF and ePub downloads, according to the available data) and Abstracts Views on Vision4Press platform.
Data correspond to usage on the plateform after 2015. The current usage metrics is available 48-96 hours after online publication and is updated daily on week days.
Initial download of the metrics may take a while.