Fig. 3.
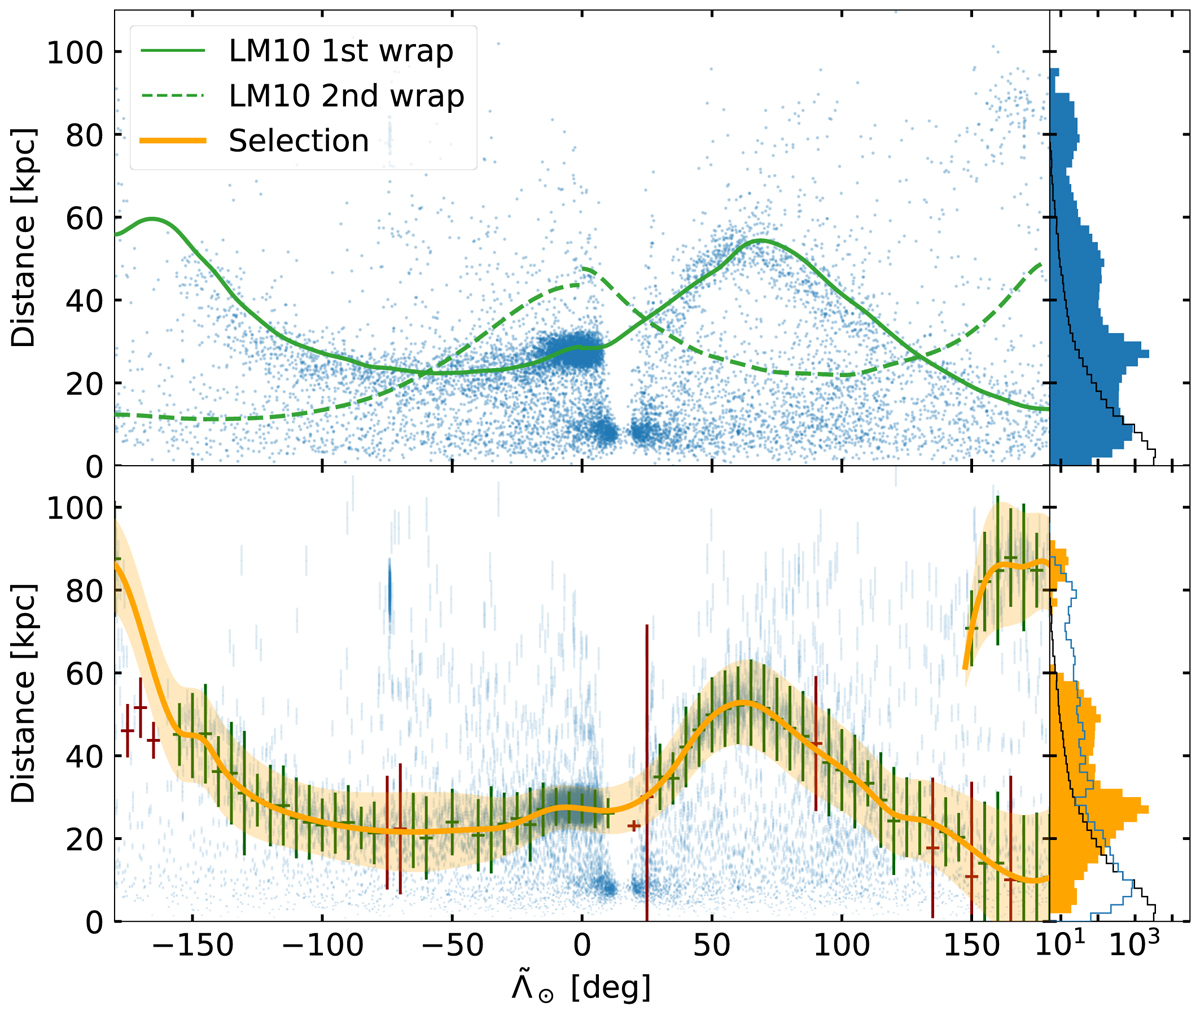
Distance as a function of ![]() for the stars in the Sgr stream. Top: all candidates selected by the nGC3 method. The green lines represent the predictions of the LM10 model for the first (solid) and second (dashed) wrap. The blue bars on the right are the histogram of the same stars, while the black steps correspond to the predictions from the mock catalogue (see text). Bottom: same stars, now with their associated uncertainties, with green (red) error bars representing the parameters extracted from the good (bad) fit to the kernel associated with Sgr (see text). We also show in orange the interpolation of the centres (dashed line) and the two-sigma interval (shaded area). The histogram on the right now shows the selected stars in orange, the remaining ones in blue, and the black one is the same as above.
for the stars in the Sgr stream. Top: all candidates selected by the nGC3 method. The green lines represent the predictions of the LM10 model for the first (solid) and second (dashed) wrap. The blue bars on the right are the histogram of the same stars, while the black steps correspond to the predictions from the mock catalogue (see text). Bottom: same stars, now with their associated uncertainties, with green (red) error bars representing the parameters extracted from the good (bad) fit to the kernel associated with Sgr (see text). We also show in orange the interpolation of the centres (dashed line) and the two-sigma interval (shaded area). The histogram on the right now shows the selected stars in orange, the remaining ones in blue, and the black one is the same as above.
Current usage metrics show cumulative count of Article Views (full-text article views including HTML views, PDF and ePub downloads, according to the available data) and Abstracts Views on Vision4Press platform.
Data correspond to usage on the plateform after 2015. The current usage metrics is available 48-96 hours after online publication and is updated daily on week days.
Initial download of the metrics may take a while.