Fig. B.1.
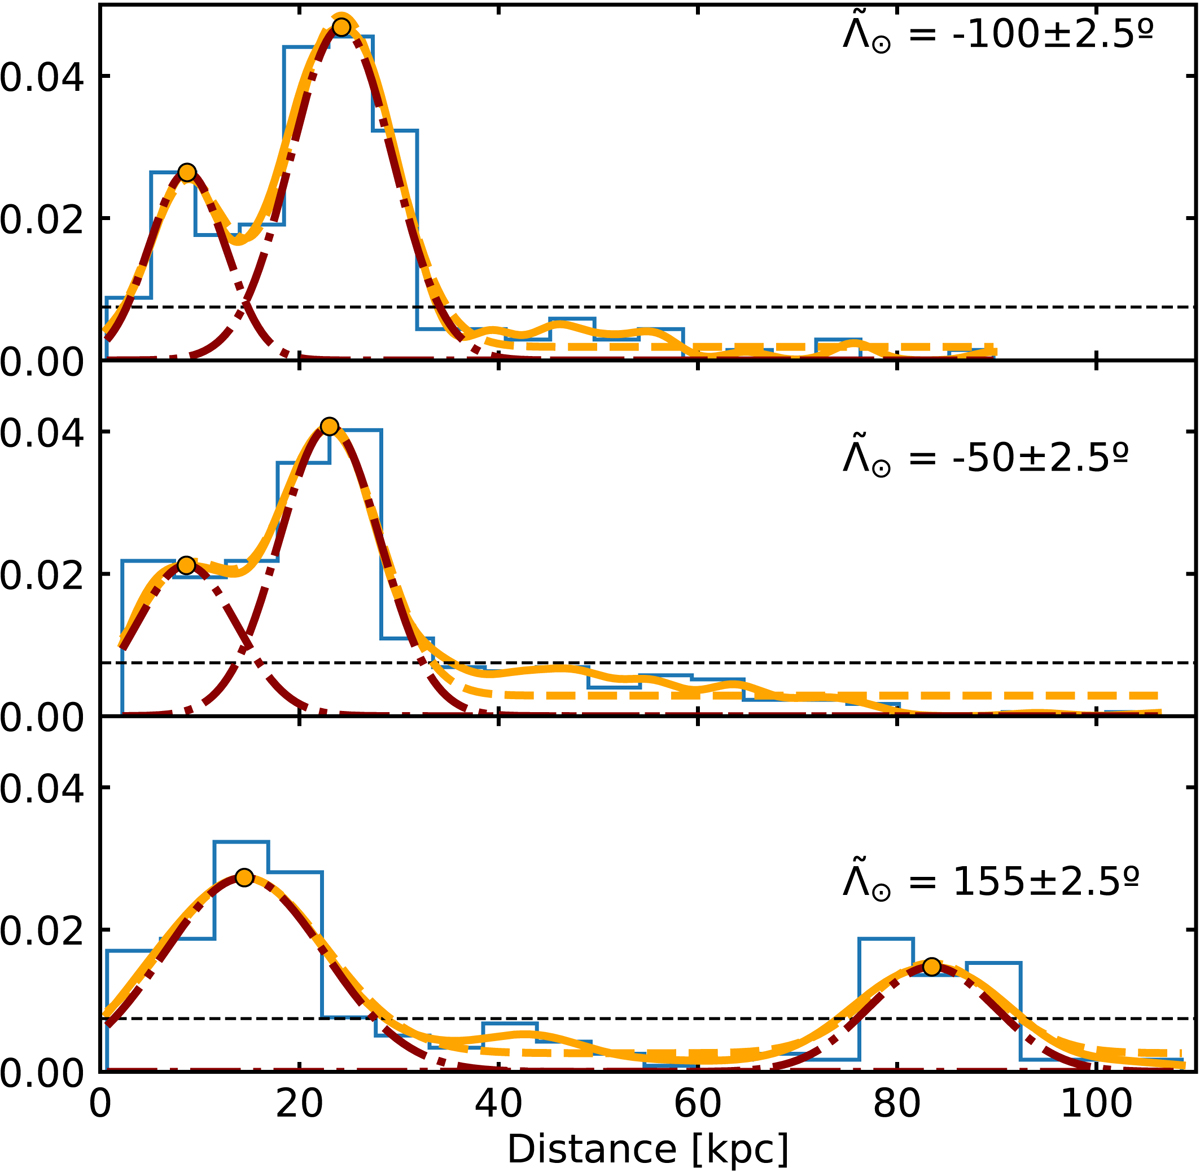
Example of the TGM applied to the distance distribution at selected bins of ![]() = [−100°,−50°,155°] for the Strip sample. The blue steps show a histogram of the heliocentric distance of all stars with a bin size of 5°. The solid orange line is the kernel obtained with the parameters detailed in the text. The orange dots that appear on top of it are the peaks detected and the red lines the corresponding Gaussian distributions obtained from the fit. Finally, the orange dashed line is the reconstruction of the kernel with the individual Gaussians added together.
= [−100°,−50°,155°] for the Strip sample. The blue steps show a histogram of the heliocentric distance of all stars with a bin size of 5°. The solid orange line is the kernel obtained with the parameters detailed in the text. The orange dots that appear on top of it are the peaks detected and the red lines the corresponding Gaussian distributions obtained from the fit. Finally, the orange dashed line is the reconstruction of the kernel with the individual Gaussians added together.
Current usage metrics show cumulative count of Article Views (full-text article views including HTML views, PDF and ePub downloads, according to the available data) and Abstracts Views on Vision4Press platform.
Data correspond to usage on the plateform after 2015. The current usage metrics is available 48-96 hours after online publication and is updated daily on week days.
Initial download of the metrics may take a while.