Fig. 10.
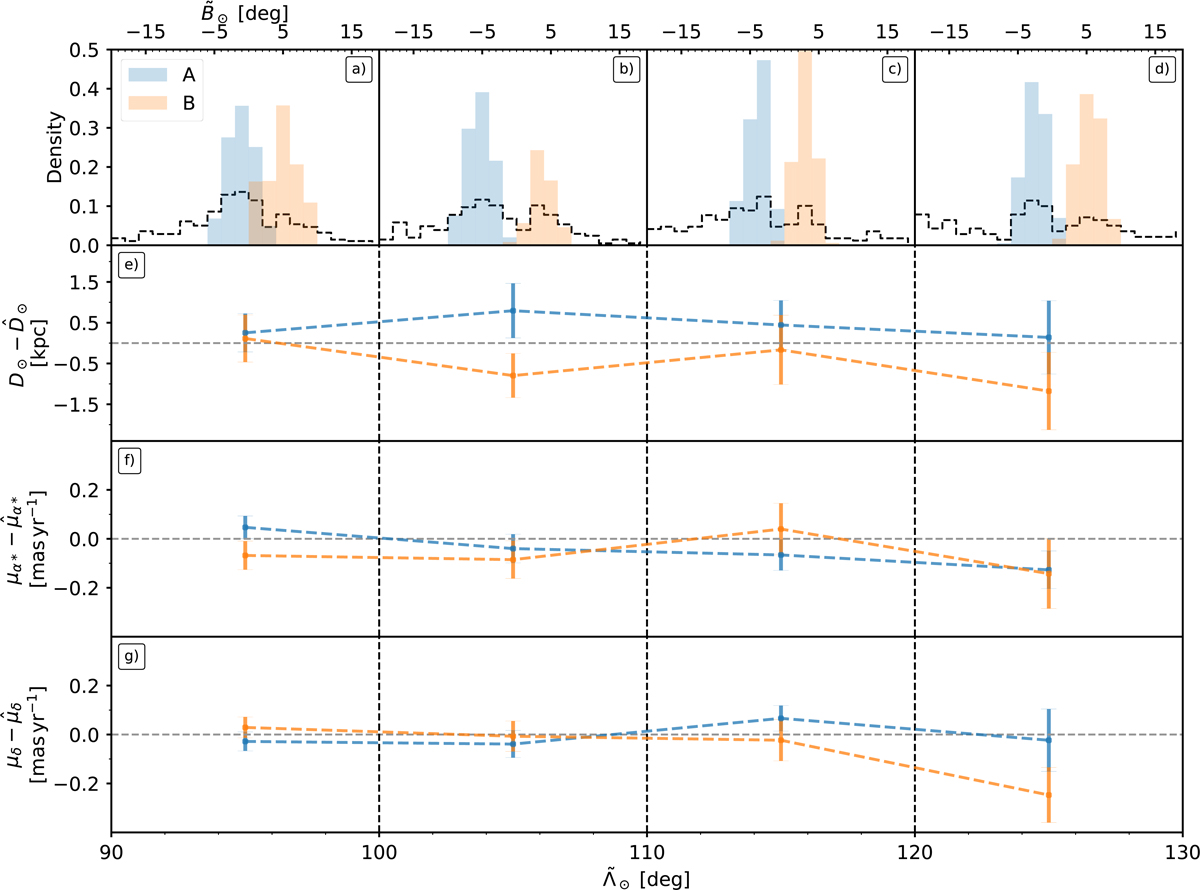
Comparison between the bright (A, blue) and faint (B, orange) branches of the bifurcation at different ![]() (Strip sample). Top panels a–d: histogram of
(Strip sample). Top panels a–d: histogram of ![]() (black line) corresponding to the stars that fall in the range of
(black line) corresponding to the stars that fall in the range of ![]() , from left to right, [90°–100°, 100°–110°, 110°–120°, 120°–130°]. We also show the weighted histograms for each branch, which highlight the stars that contribute to compute the means plotted in the panels below. Panele: we plot the weighted mean heliocentric distance, after subtracting the median distance, and the associated error. Panelsf and g: weighted mean and its error for the proper motion in right ascension and in declination, respectively. Here we also subtract the median value of the bin to cancel the overall gradients.
, from left to right, [90°–100°, 100°–110°, 110°–120°, 120°–130°]. We also show the weighted histograms for each branch, which highlight the stars that contribute to compute the means plotted in the panels below. Panele: we plot the weighted mean heliocentric distance, after subtracting the median distance, and the associated error. Panelsf and g: weighted mean and its error for the proper motion in right ascension and in declination, respectively. Here we also subtract the median value of the bin to cancel the overall gradients.
Current usage metrics show cumulative count of Article Views (full-text article views including HTML views, PDF and ePub downloads, according to the available data) and Abstracts Views on Vision4Press platform.
Data correspond to usage on the plateform after 2015. The current usage metrics is available 48-96 hours after online publication and is updated daily on week days.
Initial download of the metrics may take a while.