Fig. 1.
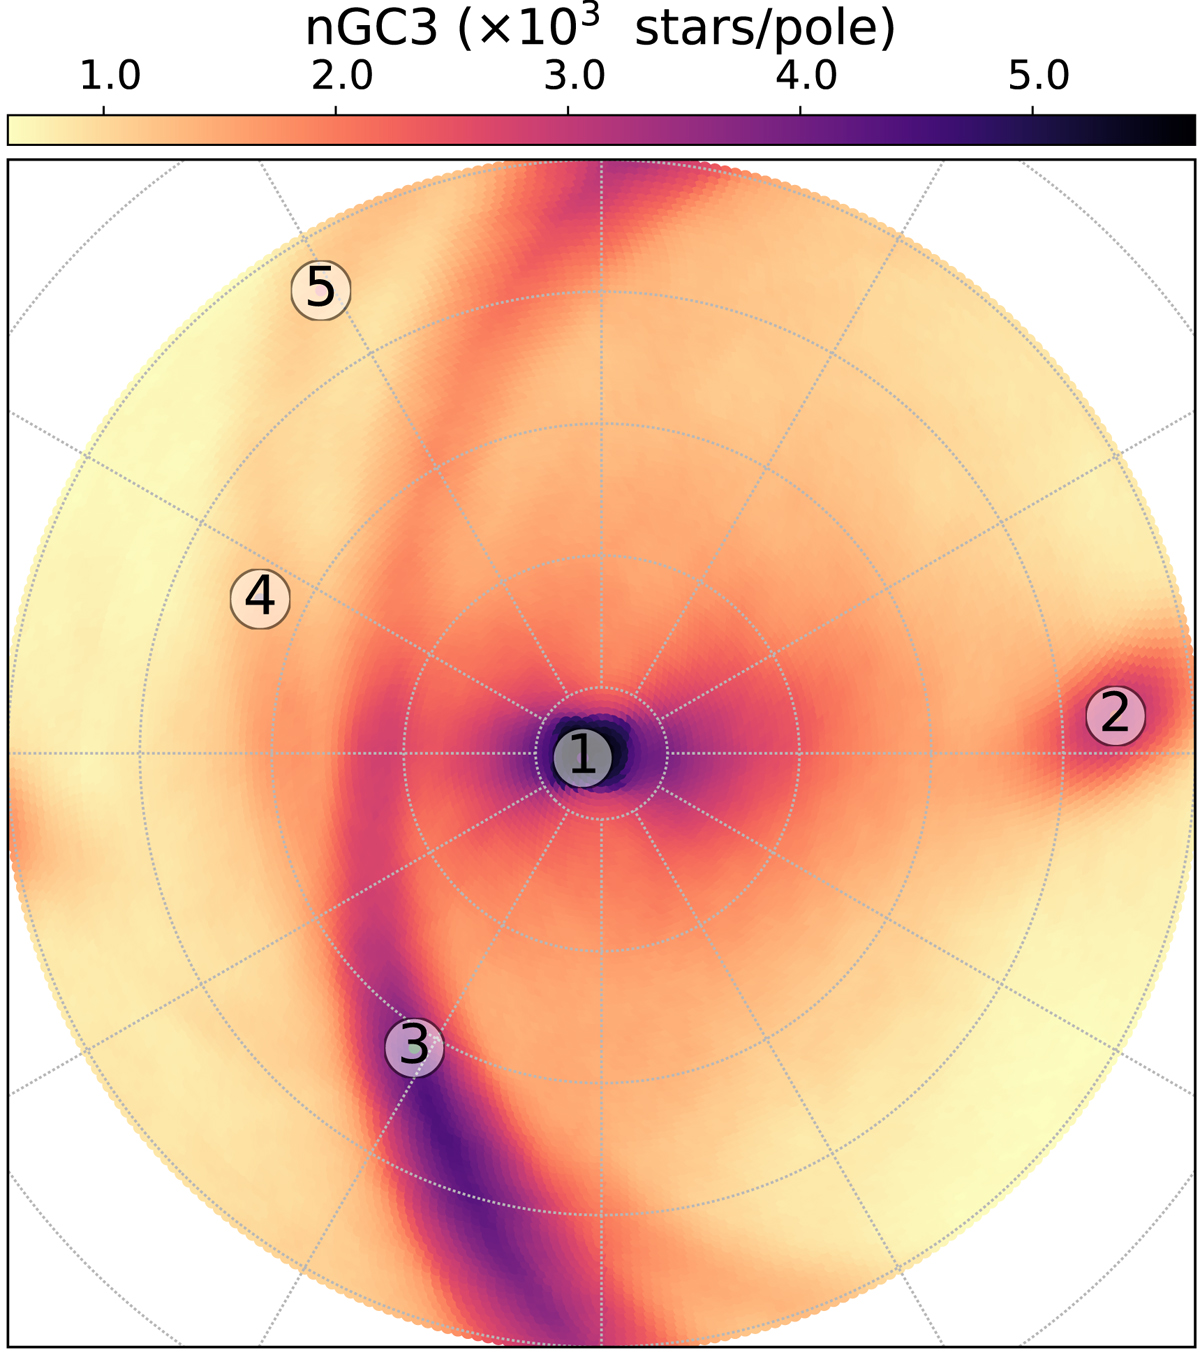
Pole Count Map of the RR Lyrae catalogue described in Sect. 2. The Galactic disc produces the large concentration at (1), while the peaks (3),(4), and (5) are related to the Large and Small Magellanic clouds. The prominent signal on the right, (2), is caused by the Sgr stream.
Current usage metrics show cumulative count of Article Views (full-text article views including HTML views, PDF and ePub downloads, according to the available data) and Abstracts Views on Vision4Press platform.
Data correspond to usage on the plateform after 2015. The current usage metrics is available 48-96 hours after online publication and is updated daily on week days.
Initial download of the metrics may take a while.