| Issue |
A&A
Volume 638, June 2020
|
|
|---|---|---|
| Article Number | A47 | |
| Number of page(s) | 7 | |
| Section | Extragalactic astronomy | |
| DOI | https://doi.org/10.1051/0004-6361/202037692 | |
| Published online | 09 June 2020 | |
Connection of supernovae 2002ap, 2003gd, 2013ej, and 2019krl in M 74 with atomic gas accretion and spiral structure
1
Astronomical Observatory Institute, Faculty of Physics, Adam Mickiewicz University, ul. Słoneczna 36, 60-286 Poznań, Poland
e-mail: This email address is being protected from spambots. You need JavaScript enabled to view it.
2
TAPIR, Mailcode 350-17, California Institute of Technology, Pasadena, CA 91125, USA
3
Institute of Physics, Faculty of Physics, Astronomy and Informatics, Nicolaus Copernicus University, Grudzidzka 5, 87-100 Toruń, Poland
4
DARK, Niels Bohr Institute, University of Copenhagen, Lyngbyvej 2, 2100 Copenhagen, Denmark
5
Ruhr-Universität Bochum, Faculty of Physics and Astronomy, Astronomical Institute, 44780 Bochum, Germany
Received:
9
February
2020
Accepted:
13
April
2020
Abstract
Studying the nature of various types of supernovae (SNe) is important for our understanding of stellar evolution. Observations of atomic and molecular gas in the host galaxies of gamma-ray bursts (GRBs) and SNe have recently been used to learn about the nature of the explosions themselves and the star formation events during which their progenitors were born. Based on archival data for M 74, which previously has not been investigated in the context of SN positions, we report the gas properties in the environment of the broad-lined type Ic (Ic-BL) SN 2002ap and the type II SNe 2003gd, 2013ej, and 2019krl. The SN 2002ap is located at the end of an off-centre, asymmetric, 55 kpc-long HI extension containing 7.5% of the total atomic gas in M 74, interpreted as a signature of external gas accretion. It is the fourth known case of an explosion of a presumably massive star located close to a concentration of atomic gas (after GRBs 980425, 060505, and SN 2009bb). It is unlikely that all these associations are random (at a 3σ significance), so the case of SN 2002ap adds to the evidence that the birth of the progenitors of type Ic-BL SNe and GRBs is connected with the accretion of atomic gas from the intergalactic medium. The HI extension could come from tidally disrupted companions of M 74, or be a remnant of a galaxy or a gas cloud that accreted entirely from the intragroup medium. The other (type II) SNe in M 74 are located at the outside edge of a spiral arm. This suggests that either their progenitors were born when gas was piling up there or that the SN progenitors moved away from the arm due to their orbital motions. These type II SNe do not seem to be related to gas accretion.
Key words: galaxies: evolution / galaxies: individual: M 74 / galaxies: ISM / galaxies: star formation / supernovae: individual: 2002ap / radio lines: galaxies
Fulbright Senior Award Fellow.
© ESO 2020
1. Introduction
The nature of various types of supernovae (SNe) carry crucial information about stellar evolution. A subclass of SNe with no hydrogen, helium, or silicon lines in the spectrum (known as type Ic) are believed to be explosions of stars born with very high masses. Those exhibiting broad emission lines, indicating high velocities of the ejected material (up to a few 104 km s−1), are called “hypernovae” or SNe type Ic-BL (broad lined). Some of these SNe also show relativistic ejecta, for example SN 1998bw (GRB 980425 Galama et al. 1998) and 2009bb (Soderberg et al. 2010). These relativistic features are interpreted as a jet, and indeed some Ic-BL SNe have been associated with gamma-ray bursts (GRBs; Hjorth & Bloom 2012).
Observations of atomic and molecular gas (through 21 cm HI and carbon monoxide [CO] lines, respectively) in host galaxies of GRBs and SNe have recently been used to learn about the nature of the explosions themselves, as well as the star formation event during which their progenitors were born. Michałowski et al. (2015, 2016, 2018a) and Arabsalmani et al. (2015, 2019) showed that GRBs and a relativistic SN type Ic-BL exploded close to the most HI-rich region of their hosts, which was interpreted as being the result of a recent gas accretion or a galaxy merger. While this conclusion was based on very small samples, if substantiated it would have important consequences for our understanding of the conditions necessary for such explosions, as well as for triggering star formation in general. This motivates us to study the gas properties of another Ic-BL SN (to date, amongst the hosts of Ic-BL SNe, atomic gas was studied in only one case; Michałowski et al. 2018a).
SN 2002ap (Nakano et al. 2002) exploded ∼4.7′ (∼12.7 kpc) from the centre of Messier 74 (M 74 or NGC 628) and was classified as a type Ic-BL (Mazzali et al. 2002; Kinugasa et al. 2002; Gal-Yam et al. 2002; Foley et al. 2003). Its estimated progenitor mass is 20 − 25 M⊙, lower than other hypernovae, including SN 1998bw (Mazzali et al. 2002). SN 2002ap was also shown to have only modest relativistic ejecta, and hence no detectable jet (Berger et al. 2002). The progenitor was proposed to be a Wolf-Rayet (WR) star or a massive star in an interacting binary (Smartt et al. 2002; Wang et al. 2003).
M 74 has hosted three other known SNe: 2003gd (type IIP; ∼2.7′ or ∼7.3 kpc from the galaxy centre; Hendry et al. 2005), 2013ej (IIP; ∼2.2′ or ∼5.9 kpc; Valenti et al. 2014), and 2019krl (IIn; 1.9′ or ∼5.2 kpc; Ho 2019; Andrews et al. 2019). The progenitor of SN 2003gd was confirmed to be an M-type supergiant with a mass of ∼8 M⊙, by examining the SN position in pre- and post-explosion images, which revealed that this star was missing in the latter (Maund & Smartt 2009; Van Dyk et al. 2003; Smartt et al. 2004). In a similar way, the mass of the progenitor of SN 2013ej was estimated to be 8.0 − 15.5 M⊙ (Fraser et al. 2014; Mauerhan et al. 2017).
The objectives of this paper are to (i) test whether SN 2002ap and other SNe in M 74 were born in concentrations of gas indicating a recent gas accretion, and (ii) investigate what this tells us about the formation of SN progenitors. We adopt a redshift of M 74 of z = 0.00219 (Lu et al. 1993), a distance of 9.4 Mpc, and a corresponding scale of 2.7 kpc arcmin−1. This assumes a cosmological model with H0 = 70 km s−1 Mpc−1, ΩΛ = 0.7, and Ωm = 0.3.
2. Selection and data
The supernova SN 2002ap and its host galaxy M 74 were selected as part of a larger study of gas in SN hosts (Gotkiewicz & Michałowski, in prep.). We investigated all known SNe up to Aug 2018 with redshifts z < 0.1 from the Open Supernova Catalog1 (Guillochon et al. 2017) and searched the NASA/IPAC Extragalactic Database (NED) for HI data for their hosts. SN 2002ap was the only SN type Ic-BL that satisfied these criteria.
The archival HI and CO data for M 74 are shown in Figs. 1 and 2, while the rest of the data are shown in Fig. 3. HI data are from Kamphuis & Briggs (1992, a resolution of 72″ × 62″) and The HI Nearby Galaxy Survey (THINGS; Walter et al. 2008, a resolution of 11.9″ × 9.3″ and 6.9″ × 5.6″). The CO(2–1) data are from the HERA CO Line Extragalactic Survey (HERACLES; Leroy et al. 2009, a resolution of 13.4″). The Hα image is from Marcum et al. (2001). In addition, we use the following continuum data: the Swift (Gehrels et al. 2004; Roming et al. 2005) UVW2 0.2 μm image (Brown et al. 2014); Spitzer (Werner et al. 2004; Fazio et al. 2004) 3.6 and 8.0 μm images (Dale et al. 2009), Herschel (Pilbratt et al. 2010; Poglitsch et al. 2010) 160 μm image (Kennicutt et al. 2011), and National Science Foundation’s (NSF’s) Karl G. Jansky Very Large Array (VLA) 3.1 GHz image (Mulcahy et al. 2017).
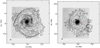 |
Fig. 1. Low resolution HI map (the beam size of 72″ × 62″) superimposed on an optical image of M 74. The position of SN 2002ap is marked as the red dot (credit: Kamphuis & Briggs 1992, reproduced with permission © ESO). Left: zeroth moment map (integrated emission). Right: first moment map (velocity fields). The asymmetric tail with an irregular velocity field is visible at the south-western outskirt of the atomic disc (around the position of RA = 1h33m20s, Dec = 15° 25m). North is up and east is to the left. |
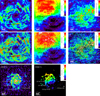 |
Fig. 2. Gas distribution in M 74. Top and middle: HI data with a resolution of 11.9″ × 9.3″ and 6.9″ × 5.6″, respectively (Walter et al. 2008). Bottom: CO(2–1) data with a resolution of 13.4″ (Leroy et al. 2009). Left: zeroth moment maps (integrated emission). Middle: first moment maps (velocity fields) relative to z = 0.00219 (656.545 km s−1). Right: second moment maps (velocity dispersion). The positions of SNe are marked by grey circles. The lines outline the main spiral arm. Each panel is 10′ per side. North is up and east is to the left. |
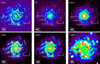 |
Fig. 3. Ultraviolet, Hα, mid-IR, far-IR, and radio images of M 74. The positions of SNe are marked by grey circles. The lines outline the main spiral arm. Each panel is 10′ per side. North is up and east is to the left. |
3. Results
According to Kamphuis & Briggs (1992), M 74 harbours an off-centre asymmetric HI tail, located on the south-western outskirts of the galaxy, outside the optical disc (Fig. 1). The feature is detected over 20′ (55 kpc) and contains log(MHI/M⊙) = 8.95, or 7.5% of the total atomic gas of M 74. SN 2002ap is located where this feature connects with the symmetric disc of M 74. The velocity pattern of the feature is irregular (Fig. 1). This gas does not follow the overall rotation of the gas disc, as evidenced by both negative and positive velocity residuals from the disc models at this location presented in Figs. 8 and 9 of Kamphuis & Briggs (1992).
The higher resolution THINGS data are not sensitive to such large scales, but allow detailed investigation of the local environments of SNe. At this resolution, the position of SN 2002ap is not associated with any strong concentration of atomic or molecular gas (Fig. 2). SN 2002ap is located ∼80″ (3.6 kpc) south-west of the main spiral arm running from the south to the west of the galaxy (marked as a curved region on Figs. 2 and 3, traced clearly on all images up to the southernmost point, and by the HI and 3.1 GHz images to the west) and ∼20″ (0.9 kpc) from a bright HI knot to the north. The main spiral arm in the south is also visible in the HI velocity map in which the integrated mean velocities show a larger deviation from the systemic velocity in the interarm regions.
Moreover, SN 2002ap exploded away from regions of significant star formation activity and very little emission is present at its position at any wavelength (Fig. 3). There is, however, a faint star-forming region visible in the UV ∼4″ (180 pc) away from the SN position (this is not the object 10″ away mentioned by Crowther 2013). SN 2002ap is also outside the CO disc.
The other three type II SNe in M 74 exploded along the most prominent spiral arm (running from the east to south of M 74; curved regions on Figs. 2 and 3), but are displaced from the arm towards the outside by ∼25″ (∼1 kpc). This is especially evident in the Hα, 3.6 μm, and CO images. SN 2013ej and 2019krl exploded in interarm regions with very little HI, 8, 160 μm, and 3.1 GHz emission. All three type II SNe exploded in regions with undetectable CO emission.
We have investigated the large-scale environment of M 74. Within 150 kpc (55′) and ±500 km s−1 from M 74 (velocity of 627 km s−1), NED lists three galaxies: UGC 1171, UGC 1176, both to the east, and the much fainter SDSS J013800.30+145858.1 to the south. All of them are detected in HI by the Arecibo Legacy Fast ALFA Survey (ALFALFA; Haynes et al. 2018). In Table 1 we list their properties.
Properties of galaxies in the vicinity of M 74 from the ALFALFA survey (Haynes et al. 2018).
In the ALFALFA catalogue within 200″ (540 kpc) of M 74 there are in total 13 galaxies. All but one have atomic gas masses 7 < log(MHI/M⊙) < 9. Only NGC 660, 426 kpc away, with log(MHI/M⊙) = 9.59 has a mass comparable to that of M 74. The positions of these galaxies are shown on Fig. 4.
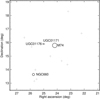 |
Fig. 4. Large-scale environment around M 74 within ±500 km s−1. The width of the panel is 400′ (∼1 Mpc). Circles show the sizes of larger galaxies: 20′ for M 74, 10′ for NGC 660, 5′ for UGC 1176, and 1.4′ for UGC 1171 (a small circle next to UGC 1176). Crosses show the positions of additional galaxies detected at the HI line by ALFALFA (Haynes et al. 2018). |
4. Discussion
The estimated mass of the progenitor of SN 2002ap implies that it was formed 3.2−5.6 Myr before the explosion, whereas the progenitors of SN 2003gd and 2013ej were formed 10−55 Myr before the explosions (assuming a main-sequence lifetime of 1010 yr × [M/M⊙]−2.5; Kippenhahn & Weigert 1990). This lifetime for SN 2002ap agrees with the single-progenitor estimate of Zapartas et al. (2017, 5 Myr), but is lower than the binary-progenitor estimate (20 Myr). Similarly, Maund (2018) obtained an age of 15 Myr based on the analysis of stars in the vicinity of SN 2002ap.
4.1. Type Ic-BL SN 2002ap
The supernova SN 2002ap is the fourth known explosion of a presumably massive star located close to a concentration of atomic gas. Similarly to SN 2002ap, GRB 060505 and SN 2009bb were both located close to HI extensions, whereas GRB 980425 was located close to the most significant HI concentration (Michałowski et al. 2015, 2018a; Arabsalmani et al. 2015, 2019).
We can assess the statistical significance of the associations of the HI off-centre concentrations with the GRB and SN positions by investigating the probability of four GRBs and SNe exploding by chance in the quadrants of their hosts at which these HI concentrations are located. For a given explosion this probability is 0.25, so for four out of four analysed cases this is (0.25)4 ∼ 0.004. This corresponds to ∼3σ, so the associations are unlikely to be random, but a larger sample is needed to confirm this result.
The case of SN 2002ap adds to the hypothesis put forward in Michałowski et al. (2015) that the progenitors of these explosions are born when atomic gas is accreted from the intergalactic medium. Indeed, Kamphuis & Briggs (1992) concluded that the south-western HI extension in M 74 is a result of an accretion event because it has not settled yet, and is inconsistent with the rotation of the gas disc. This extension may be the gas flowing in and feeding star formation directly, or distorting gas on the outskirts of the optical disc of the galaxy leading to star formation at the position of SN 2002ap.
The asymmetric tail in M 74 has a mass of log(MHI/M⊙) = 8.95. This is comparable to the mass of the most massive galaxy within 150 kpc (UGC 1176) and only a factor of four less than the atomic gas mass of NGC 660. The sum of atomic masses of all galaxies within 200′ (540 kpc) excluding NGC 660 is log(MHI/M⊙) = 9.36. Hence, the tail in M 74 might have come from UGC 1176 if it was significantly distorted by the interaction and lost half of its gas, or from NGC 660. It could also be a remnant of a galaxy similar to UGC 1176 that has been accreted entirely (as postulated by Kamphuis & Briggs 1992), or a result of the accretion of intragroup medium.
In principle this tail could be a remnant of a tidal feature created by interaction with these galaxies, but we found this interpretation unlikely. First, the tail does not resemble recent tidal features, whereas an older feature would wind almost symmetrically around the galaxy. Second, simulations shows that tidal tails are created on both sides of interacting galaxies (Hopkins et al. 2006; Hayward et al. 2012, 2014; Pettitt et al. 2016; Oh et al. 2015), whereas M 74 does not have such feature on the other side. We also note that the asymmetric nature of M 74, with the southern arm being stronger than the northern one (Fig. 2), could be a result of interaction with the UGC 1176/1171 pair.
The only possible counter-example of a potential explosion of a massive star without an associated gas concentration is the enigmatic transient AT 2018cow, whose host galaxy does not show such off-centre asymmetric HI features (Michałowski et al. 2019) and possibly only a gas ring (Roychowdhury et al. 2019). Such an HI ring would also be apparent for M 74 if it was further away so the sensitivity and resolution were poorer, because the central part is devoid of atomic gas, likely due to conversion to the molecular phase (Fig. 2). To demonstrate this we smoothed the HI VLA image with a Gaussian with a full width half maximum of 100″ (4.5 kpc; Fig. A.1 in the appendix). At this resolution the spiral structure of M 74 resembles an irregular ring, similar to that detected for the AT 2018cow host (for which the resolution was around 2 kpc). However, the nature of AT 2018cow is not clear, so it may not be connected with the explosion of a massive star (Prentice et al. 2018; Liu et al. 2018; Kuin et al. 2019; Perley et al. 2019; Soker et al. 2019; Lyutikov & Toonen 2019; Bietenholz et al. 2020, but see Prentice et al. 2018; Rivera 2018; Margutti et al. 2019; Fox & Smith 2019; Huang et al. 2019).
It is unlikely that the lack of molecular gas or star formation at the position of SN 2002ap is due to the progenitor being kicked out of a star-forming region. The velocities of runaway stars are up to 200 km s−1 (Blaauw 1993; Hoogerwerf et al. 2001; Eldridge et al. 2011), which corresponds to 1 kpc per 5 Myr. This is only ∼20″ at the distance of M 74, so not sufficient to move the birth place of the SN 2002ap progenitor to any place of significant star formation or CO concentration. This is true even if the lifetime of the progenitor is three to four times longer (15−20 My; Zapartas et al. 2017; Maund 2018). CO deficiency at GRB positions was also claimed by Hatsukade et al. (2014), Stanway et al. (2015), and Michałowski et al. (2016, 2018b), but Perley et al. (2017), and Arabsalmani et al. (2018) suggest an alternative. If the lack of molecular gas is confirmed for a larger sample of type Ic-BL SNe, this would support the hypothesis of HI-fuelled star formation giving rise to the birth of their progenitors (Michałowski et al. 2015).
It is unlikely that the SN 2002ap progenitor moved to its explosion position due to a random kick. Assuming a lifetime of 5 Myr, the SN 2002ap progenitor could not be born in the main arm, as the required velocity is 700 km s−1 to cross 3.6 kpc. Even the closest bcenter HI knot to the north is likely too far to be the birthplace, as this would require a velocity of 175 km s−1. Such velocity kicks are at the high end for runaway stars (Hoogerwerf et al. 2001). For the longer lifetime estimates of 15–20 Myr, the required velocities from the spiral arm would be 235–175 km s−1, so still too high for the SN 2002ap progenitor to have been born there. However, in such a case it is feasible that it was born in the closest bcenter HI knot to the north, as this would require velocities of 60–40 km s−1.
4.2. Type II SN 2003gd, 2013ej, and 2019krl
All type II SNe in M 74 are not located close to the HI extension, so are unlikely connected to gas accretion. They are located at the outside edge of a spiral arm. This can be explained by either of two scenarios: by a gas density build-up and shock scenario at the edge of the arm, or by SN progenitors moving away from the arm during their lifetimes.
The first possibility is that the SN progenitors are born when gas is piling up and shocked at the edge of the arm when gas clouds are being swept up by the arm, as explained by the spiral density wave theory (Shu 2016). This is similar to the hypothesis presented in Michałowski et al. (2014) that GRB progenitors are preferentially born in high-density gas. We note that the amount of gas piling up at the edge of the arm giving rise to the birth of SN progenitors cannot be large, because the concentration is not detected with HI or CO observations.
The SNe in M 74 are on the outside of the spiral arm, so this scenario is only valid if they are outside the corotation radius (where the orbital velocity is equal to the spiral pattern speed), so the arm is catching up with gas that is moving slower (Shu 2016). Aramyan et al. (2016) found that core-collapse SNe are indeed shifted towards the outside edge of spiral arms as long as they are outside the corotation radius. Unfortunately the accuracy of the estimate of the corotation radius for M 74 is not sufficient to test this. The corotation radius given by Scarano & Lépine (2013)2 is (2.4 ± 0.6)′, corresponding to (6.4 ± 1.7) kpc with our adopted distance, so it cannot be established whether type II SNe are inside or outside this radius. Karapetyan et al. (2018) quoted a slightly lower (but consistent within errors) value of the corotation radius3 of (1.9 ± 0.5)′, concluding that SNe 2003gd and 2013ej are indeed outside the corotation radius, supporting the spiral density wave scenario for their formation. This scenario cannot explain the birth of the SN 2002ap progenitor, because gas should not pile up so far away (3.6 kpc; Fig. 2) from the spiral arm.
However, the region of increased gas density and shocks, predicted by the spiral density wave theory, does manifest itself with increased star formation, and therefore more intense UV and Hα emission. These main sites of star formation are where SN progenitors should be born, not 1 kpc away. This scenario does not explain this discrepancy.
The second possibility is that SN progenitors are in fact born in the spiral arm, but, due to their orbital motions, move away before they explode. Inside the corotation radius stars (and gas) are moving faster than the spiral pattern, so are constantly drifting towards the outside of the arm. This means that SNe with progenitors with long enough lifetimes should be happening preferentially outside the arm. On the other hand, Hα emission is dominated by stars born very recently (i.e. after the SN progenitors), which have therefore not yet moved away from the arm.
The lifetimes of type II progenitors imply that they would need to have (reasonable) velocities of 18 − 100 km s−1 with respect to the arm to cross 1 kpc from the arm to their current position. We note that this velocity is not due to any random-direction kick, but is the orbital velocity minus the spiral pattern speed.
The orbital migration scenario requires that type II SNe progenitors are inside the corotation radius, so their orbital motion is faster than the spiral pattern and so they can leave it on the outside edge (e.g. Aramyan et al. 2016). This effect is also visible in M51 where younger stellar clusters have a distribution that has the strongest correlation with the distribution of star formation, and they are shifted towards the outside of the arm inside the corotation radius (Scheepmaker et al. 2009).
This scenario cannot explain the position of SN 2002ap, because it is located securely outside the corotation radius, so cannot leave the spiral arm at the outside edge. Instead, as we discuss above, it may be connected with the gas accretion visible in the HI map of Kamphuis & Briggs (1992).
The position of SNe away from the main sites of star formation (spiral arms) is not unique to M 74. We investigated galaxies with four or more core-collapse SNe and with well-separated spiral structures from the list of Thöne et al. (2009). NGC 6946 and 4303 hosted nine and six type II SNe, respectively, and only one (1948B) and two (1999gn and 2006ov) exploded in spiral arms; the rest exploded in interarm regions or outside the detectable stellar disk (Figs. 9 and 11 of Anderson & Soto 2013). This is consistent with the spiral density wave theory and the migration scenario described above. Indeed, larger samples of type II SNe show that they do not concentrate in the bcenterest regions of their hosts (Fruchter et al. 2006; Anderson & James 2008; Leloudas et al. 2011).
5. Conclusions
We have used archival HI and CO data for M 74 (not previously investigated in the context of SN positions), together with Hα and continuum images. SN 2002ap is located at the end of an off-centre asymmetric 55 kpc-long HI extension containing 7.5% of the total atomic gas of M 74. It is the fourth known explosion of a presumably massive star that is located close to the concentration of atomic gas (after GRB 980425, 060505, and SN 2009bb). It is unlikely that all these associations are random (at a 3σ significance), so the case of SN 2002ap adds to the evidence that the birth of the progenitors of type Ic-BL SNe and GRBs is connected with the accretion of atomic gas from the intergalactic medium. The HI extension could come from tidally disrupted companions of M 74, or be a remnant of a galaxy or a gas cloud in the intragroup medium accreted entirely.
The type II SNe in M 74 do not seem to be related to gas accretion. The fact that they are located at the outside edge of a spiral arm suggests either that their progenitors are born when gas is piling up there, reaching high density, or that SN progenitors move away from the arm during their lifetimes, due to their orbital motions. This is also similar for NGC 6946 and 4303, with eight out of nine and four out of six type II SNe, respectively, located in interarm regions or outside the detectable stellar discs, not in the spiral arms.
4.6 ± 1.2 kpc and their adopted scale of 1.95 kpc arcmin−1.
The ratio of the corotation and isophotal (R25 = 5.52′) radii of 0.34 ± 0.09.
Acknowledgments
We wish to thank the referee for careful and important suggestions, Joanna Baradziej and Phillip Hopkins for discussion and comments, and Frank Briggs for permission to use the figure from Kamphuis & Briggs (1992). M.J.M. acknowledges the support of the National Science Centre, Poland through the SONATA BIS grant 2018/30/E/ST9/00208, and of the Polish-US Fulbcenter Commission. J.H. was supported by a VILLUM FONDEN Investigator grant (project number 16599). P.K. is partially supported by the BMBF project 05A17PC2 for D-MeerKAT. The National Radio Astronomy Observatory is a facility of the National Science Foundation operated under cooperative agreement by Associated Universities, Inc. This work made use of HERACLES, “The HERA CO-Line Extragalactic Survey”. This research has made use of data obtained from the High Energy Astrophysics Science Archive Research Center (HEASARC), provided by NASA’s Goddard Space Flight Center. This work is based on observations made with the Spitzer Space Telescope, which is operated by the Jet Propulsion Laboratory, California Institute of Technology under a contract with NASA. Herschel is an ESA space observatory with science instruments provided by European-led Principal Investigator consortia and with important participation from NASA. This research has made use of the Open Supernova Catalog (https://sne.space); NASA/IPAC Extragalactic Database (NED), which is operated by the Jet Propulsion Laboratory, California Institute of Technology, under contract with the National Aeronautics and Space Administration; SAOImage DS9, developed by the Smithsonian Astrophysical Observatory (Joye & Mandel 2003); Edward Wcenter cosmology calculator (Wcenter 2006); the WebPlotDigitizer of Ankit Rohatgi (https://automeris.io/WebPlotDigitizer/); and NASA’s Astrophysics Data System Bibliographic Services.
References
- Anderson, J. P., & James, P. A. 2008, MNRAS, 390, 1527 [NASA ADS] [Google Scholar]
- Anderson, J. P., & Soto, M. 2013, A&A, 550, A69 [NASA ADS] [CrossRef] [EDP Sciences] [Google Scholar]
- Andrews, J., Sand, D., Smith, N., et al. 2019, ATel, 12913, 1 [NASA ADS] [Google Scholar]
- Arabsalmani, M., Roychowdhury, S., Zwaan, M. A., Kanekar, N., & Michałowski, M. J. 2015, MNRAS, 454, L51 [NASA ADS] [CrossRef] [Google Scholar]
- Arabsalmani, M., Le Floc’h, E., Dannerbauer, H., et al. 2018, MNRAS, 476, 2332 [NASA ADS] [CrossRef] [Google Scholar]
- Arabsalmani, M., Roychowdhury, S., Starkenburg, T. K., et al. 2019, MNRAS, 485, 5411 [NASA ADS] [CrossRef] [Google Scholar]
- Aramyan, L. S., Hakobyan, A. A., Petrosian, A. R., et al. 2016, MNRAS, 459, 3130 [NASA ADS] [CrossRef] [Google Scholar]
- Berger, E., Kulkarni, S. R., & Chevalier, R. A. 2002, ApJ, 577, L5 [NASA ADS] [CrossRef] [Google Scholar]
- Bietenholz, M. F., Margutti, R., Coppejans, D., et al. 2020, MNRAS, 491, 4735 [NASA ADS] [CrossRef] [Google Scholar]
- Blaauw, A. 1993, in Massive Stars: Their Lives in the Interstellar Medium, eds. J. P. Cassinelli, & E. B. Churchwell, ASP Conf. Ser., 35, 207 [NASA ADS] [Google Scholar]
- Brown, M. J. I., Moustakas, J., Smith, J. D. T., et al. 2014, ApJS, 212, 18 [Google Scholar]
- Crowther, P. A. 2013, MNRAS, 428, 1927 [NASA ADS] [CrossRef] [Google Scholar]
- Dale, D. A., Cohen, S. A., Johnson, L. C., et al. 2009, ApJ, 703, 517 [NASA ADS] [CrossRef] [Google Scholar]
- Eldridge, J. J., Langer, N., & Tout, C. A. 2011, MNRAS, 414, 3501 [NASA ADS] [CrossRef] [Google Scholar]
- Fazio, G. G., Hora, J. L., Allen, L. E., et al. 2004, ApJS, 154, 10 [NASA ADS] [CrossRef] [Google Scholar]
- Foley, R. J., Papenkova, M. S., Swift, B. J., et al. 2003, PASP, 115, 1220 [NASA ADS] [CrossRef] [Google Scholar]
- Fox, O. D., & Smith, N. 2019, MNRAS, 488, 3772 [NASA ADS] [CrossRef] [Google Scholar]
- Fraser, M., Maund, J. R., Smartt, S. J., et al. 2014, MNRAS, 439, L56 [NASA ADS] [CrossRef] [Google Scholar]
- Fruchter, A. S., Levan, A. J., Strolger, L., et al. 2006, Nature, 441, 463 [NASA ADS] [CrossRef] [PubMed] [Google Scholar]
- Galama, T. J., Vreeswijk, P. M., van Paradijs, J., et al. 1998, Nature, 395, 670 [NASA ADS] [CrossRef] [Google Scholar]
- Gal-Yam, A., Ofek, E. O., & Shemmer, O. 2002, MNRAS, 332, L73 [NASA ADS] [CrossRef] [Google Scholar]
- Gehrels, N., Chincarini, G., Giommi, P., et al. 2004, ApJ, 611, 1005 [NASA ADS] [CrossRef] [Google Scholar]
- Guillochon, J., Parrent, J., Kelley, L. Z., & Margutti, R. 2017, ApJ, 835, 64 [NASA ADS] [CrossRef] [Google Scholar]
- Hatsukade, B., Ohta, K., Endo, A., et al. 2014, Nature, 510, 247 [NASA ADS] [CrossRef] [Google Scholar]
- Haynes, M. P., Giovanelli, R., Kent, B. R., et al. 2018, ApJ, 861, 49 [Google Scholar]
- Hayward, C. C., Jonsson, P., Kereš, D., et al. 2012, MNRAS, 424, 951 [NASA ADS] [CrossRef] [Google Scholar]
- Hayward, C. C., Torrey, P., Springel, V., Hernquist, L., & Vogelsberger, M. 2014, MNRAS, 442, 1992 [NASA ADS] [CrossRef] [Google Scholar]
- Hendry, M. A., Smartt, S. J., Maund, J. R., et al. 2005, MNRAS, 359, 906 [NASA ADS] [CrossRef] [Google Scholar]
- Hjorth, J., & Bloom, J. S. 2012, The Gamma-ray Burst – Supernova Connection (Cambridge: Cambridge University Press), 169 [CrossRef] [Google Scholar]
- Ho, A. 2019, Transient Name Server Discovery Report, 1165 [Google Scholar]
- Hoogerwerf, R., de Bruijne, J. H. J., & de Zeeuw, P. T. 2001, A&A, 365, 49 [NASA ADS] [CrossRef] [EDP Sciences] [Google Scholar]
- Hopkins, P. F., Hernquist, L., Cox, T. J., et al. 2006, ApJS, 163, 1 [Google Scholar]
- Huang, K., Shimoda, J., Urata, Y., et al. 2019, ApJ, 878, L25 [NASA ADS] [CrossRef] [Google Scholar]
- Joye, W. A., & Mandel, E. 2003, in Astronomical Data Analysis Software and Systems XII, eds. H. E. Payne, R. I. Jedrzejewski, & R. N. Hook, ASP Conf. Ser., 295, 489 [NASA ADS] [Google Scholar]
- Kamphuis, J., & Briggs, F. 1992, A&A, 253, 335 [NASA ADS] [Google Scholar]
- Karapetyan, A. G., Hakobyan, A. A., Barkhudaryan, L. V., et al. 2018, MNRAS, 481, 566 [NASA ADS] [CrossRef] [Google Scholar]
- Kennicutt, R. C., Calzetti, D., Aniano, G., et al. 2011, PASP, 123, 1347 [NASA ADS] [CrossRef] [Google Scholar]
- Kinugasa, K., Kawakita, H., Ayani, K., et al. 2002, ApJ, 577, L97 [NASA ADS] [CrossRef] [Google Scholar]
- Kippenhahn, R., & Weigert, A. 1990, Stellar Structure and Evolution (Berlin: Springer) [CrossRef] [Google Scholar]
- Kuin, N. P. M., Wu, K., Oates, S., et al. 2019, MNRAS, 487, 2505 [NASA ADS] [CrossRef] [Google Scholar]
- Leloudas, G., Gallazzi, A., Sollerman, J., et al. 2011, A&A, 530, A95 [NASA ADS] [CrossRef] [EDP Sciences] [Google Scholar]
- Leroy, A. K., Walter, F., Bigiel, F., et al. 2009, AJ, 137, 4670 [NASA ADS] [CrossRef] [Google Scholar]
- Liu, L. D., Zhang, B., Wang, L. J., & Dai, Z. G. 2018, ApJ, 868, L24 [NASA ADS] [CrossRef] [Google Scholar]
- Lu, N. Y., Hoffman, G. L., Groff, T., Roos, T., & Lamphier, C. 1993, ApJS, 88, 383 [NASA ADS] [CrossRef] [Google Scholar]
- Lyutikov, M., & Toonen, S. 2019, MNRAS, 487, 5618 [NASA ADS] [CrossRef] [Google Scholar]
- Marcum, P. M., O’Connell, R. W., Fanelli, M. N., et al. 2001, ApJS, 132, 129 [NASA ADS] [CrossRef] [Google Scholar]
- Margutti, R., Metzger, B. D., Chornock, R., et al. 2019, ApJ, 872, 18 [NASA ADS] [CrossRef] [Google Scholar]
- Mauerhan, J. C., Van Dyk, S. D., Johansson, J., et al. 2017, ApJ, 834, 118 [NASA ADS] [CrossRef] [Google Scholar]
- Maund, J. R. 2018, MNRAS, 476, 2629 [NASA ADS] [CrossRef] [Google Scholar]
- Maund, J. R., & Smartt, S. J. 2009, Science, 324, 486 [NASA ADS] [PubMed] [Google Scholar]
- Mazzali, P. A., Deng, J., Maeda, K., et al. 2002, ApJ, 572, L61 [NASA ADS] [CrossRef] [Google Scholar]
- Michałowski, M. J., Hunt, L. K., Palazzi, E., et al. 2014, A&A, 562, A70 [NASA ADS] [CrossRef] [EDP Sciences] [Google Scholar]
- Michałowski, M. J., Gentile, G., Hjorth, J., et al. 2015, A&A, 582, A78 [NASA ADS] [CrossRef] [EDP Sciences] [Google Scholar]
- Michałowski, M. J., Castro Cerón, J. M., Wardlow, J. L., et al. 2016, A&A, 595, A72 [NASA ADS] [CrossRef] [EDP Sciences] [Google Scholar]
- Michałowski, M. J., Gentile, G., Krühler, T., et al. 2018a, A&A, 618, A104 [NASA ADS] [CrossRef] [EDP Sciences] [Google Scholar]
- Michałowski, M. J., Karska, A., Rizzo, J. R., et al. 2018b, A&A, 617, A143 [NASA ADS] [CrossRef] [EDP Sciences] [Google Scholar]
- Michałowski, M. J., Kamphuis, P., Hjorth, J., et al. 2019, A&A, 627, A106 [NASA ADS] [CrossRef] [EDP Sciences] [Google Scholar]
- Mulcahy, D. D., Beck, R., & Heald, G. H. 2017, A&A, 600, A6 [NASA ADS] [CrossRef] [EDP Sciences] [Google Scholar]
- Nakano, S., Hirose, Y., Kushida, R., Kushida, Y., & Li, W. 2002, IAU Circ., 7810 [Google Scholar]
- Oh, S. H., Kim, W. T., & Lee, H. M. 2015, ApJ, 807, 73 [NASA ADS] [CrossRef] [Google Scholar]
- Perley, D. A., Krühler, T., Schady, P., et al. 2017, MNRAS, 465, L89 [NASA ADS] [CrossRef] [Google Scholar]
- Perley, D. A., Mazzali, P. A., Yan, L., et al. 2019, MNRAS, 484, 1031 [NASA ADS] [CrossRef] [Google Scholar]
- Pettitt, A. R., Tasker, E. J., & Wadsley, J. W. 2016, MNRAS, 458, 3990 [NASA ADS] [CrossRef] [Google Scholar]
- Pilbratt, G. L., Riedinger, J. R., Passvogel, T., et al. 2010, A&A, 518, L1 [CrossRef] [EDP Sciences] [Google Scholar]
- Poglitsch, A., Waelkens, C., Geis, N., et al. 2010, A&A, 518, L2 [NASA ADS] [CrossRef] [EDP Sciences] [Google Scholar]
- Prentice, S. J., Maguire, K., Smartt, S. J., et al. 2018, ApJ, 865, L3 [NASA ADS] [CrossRef] [Google Scholar]
- Rivera Sandoval, L. E., Maccarone, T. J., Corsi, A., et al. 2018, MNRAS, 480, L146 [NASA ADS] [CrossRef] [Google Scholar]
- Roming, P. W. A., Kennedy, T. E., Mason, K. O., et al. 2005, Space Sci. Rev., 120, 95 [NASA ADS] [CrossRef] [Google Scholar]
- Roychowdhury, S., Arabsalmani, M., & Kanekar, N. 2019, MNRAS, 485, L93 [NASA ADS] [CrossRef] [Google Scholar]
- Scarano, S., & Lépine, J. R. D. 2013, MNRAS, 428, 625 [NASA ADS] [CrossRef] [Google Scholar]
- Scheepmaker, R. A., Lamers, H. J. G. L. M., Anders, P., & Larsen, S. S. 2009, A&A, 494, 81 [NASA ADS] [CrossRef] [EDP Sciences] [Google Scholar]
- Shu, F. H. 2016, ARA&A, 54, 667 [NASA ADS] [CrossRef] [Google Scholar]
- Smartt, S. J., Vreeswijk, P. M., Ramirez-Ruiz, E., et al. 2002, ApJ, 572, L147 [NASA ADS] [CrossRef] [Google Scholar]
- Smartt, S. J., Maund, J. R., Hendry, M. A., et al. 2004, Science, 303, 499 [NASA ADS] [CrossRef] [Google Scholar]
- Soderberg, A. M., Chakraborti, S., Pignata, G., et al. 2010, Nature, 463, 513 [NASA ADS] [CrossRef] [Google Scholar]
- Soker, N., Grichener, A., & Gilkis, A. 2019, MNRAS, 484, 4972 [NASA ADS] [CrossRef] [Google Scholar]
- Stanway, E. R., Levan, A. J., Tanvir, N. R., et al. 2015, ApJ, 798, L7 [NASA ADS] [CrossRef] [Google Scholar]
- Thöne, C. C., Michałowski, M. J., Leloudas, G., et al. 2009, ApJ, 698, 1307 [NASA ADS] [CrossRef] [Google Scholar]
- Valenti, S., Sand, D., Pastorello, A., et al. 2014, MNRAS, 438, L101 [Google Scholar]
- Van Dyk, S. D., Li, W., & Filippenko, A. V. 2003, PASP, 115, 1289 [NASA ADS] [CrossRef] [Google Scholar]
- Walter, F., Brinks, E., de Blok, W. J. G., et al. 2008, AJ, 136, 2563 [NASA ADS] [CrossRef] [Google Scholar]
- Wang, L., Baade, D., Höflich, P., & Wheeler, J. C. 2003, ApJ, 592, 457 [NASA ADS] [CrossRef] [Google Scholar]
- Werner, M. W., Roellig, T. L., Low, F. J., et al. 2004, ApJS, 154, 1 [NASA ADS] [CrossRef] [Google Scholar]
- Wright, E. L. 2006, PASP, 118, 1711 [NASA ADS] [CrossRef] [Google Scholar]
- Zapartas, E., de Mink, S. E., Van Dyk, S. D., et al. 2017, ApJ, 842, 125 [NASA ADS] [CrossRef] [Google Scholar]
Appendix A: Additional figure
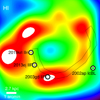 |
Fig. A.1. HI VLA image (presented in Fig. 2) smoothed using a Gaussian with full width at half maximum of 100″. The spiral structure at this resolution resembles an irregular ring. The positions of SNe are marked by grey circles. The lines outline the main spiral arm. The panel is 10′ per side. North is up and east is to the left. |
All Tables
Properties of galaxies in the vicinity of M 74 from the ALFALFA survey (Haynes et al. 2018).
All Figures
|
Fig. 1. Low resolution HI map (the beam size of 72″ × 62″) superimposed on an optical image of M 74. The position of SN 2002ap is marked as the red dot (credit: Kamphuis & Briggs 1992, reproduced with permission © ESO). Left: zeroth moment map (integrated emission). Right: first moment map (velocity fields). The asymmetric tail with an irregular velocity field is visible at the south-western outskirt of the atomic disc (around the position of RA = 1h33m20s, Dec = 15° 25m). North is up and east is to the left. |
| In the text | |
|
Fig. 2. Gas distribution in M 74. Top and middle: HI data with a resolution of 11.9″ × 9.3″ and 6.9″ × 5.6″, respectively (Walter et al. 2008). Bottom: CO(2–1) data with a resolution of 13.4″ (Leroy et al. 2009). Left: zeroth moment maps (integrated emission). Middle: first moment maps (velocity fields) relative to z = 0.00219 (656.545 km s−1). Right: second moment maps (velocity dispersion). The positions of SNe are marked by grey circles. The lines outline the main spiral arm. Each panel is 10′ per side. North is up and east is to the left. |
| In the text | |
|
Fig. 3. Ultraviolet, Hα, mid-IR, far-IR, and radio images of M 74. The positions of SNe are marked by grey circles. The lines outline the main spiral arm. Each panel is 10′ per side. North is up and east is to the left. |
| In the text | |
|
Fig. 4. Large-scale environment around M 74 within ±500 km s−1. The width of the panel is 400′ (∼1 Mpc). Circles show the sizes of larger galaxies: 20′ for M 74, 10′ for NGC 660, 5′ for UGC 1176, and 1.4′ for UGC 1171 (a small circle next to UGC 1176). Crosses show the positions of additional galaxies detected at the HI line by ALFALFA (Haynes et al. 2018). |
| In the text | |
|
Fig. A.1. HI VLA image (presented in Fig. 2) smoothed using a Gaussian with full width at half maximum of 100″. The spiral structure at this resolution resembles an irregular ring. The positions of SNe are marked by grey circles. The lines outline the main spiral arm. The panel is 10′ per side. North is up and east is to the left. |
| In the text | |
Current usage metrics show cumulative count of Article Views (full-text article views including HTML views, PDF and ePub downloads, according to the available data) and Abstracts Views on Vision4Press platform.
Data correspond to usage on the plateform after 2015. The current usage metrics is available 48-96 hours after online publication and is updated daily on week days.
Initial download of the metrics may take a while.