Fig. 1.
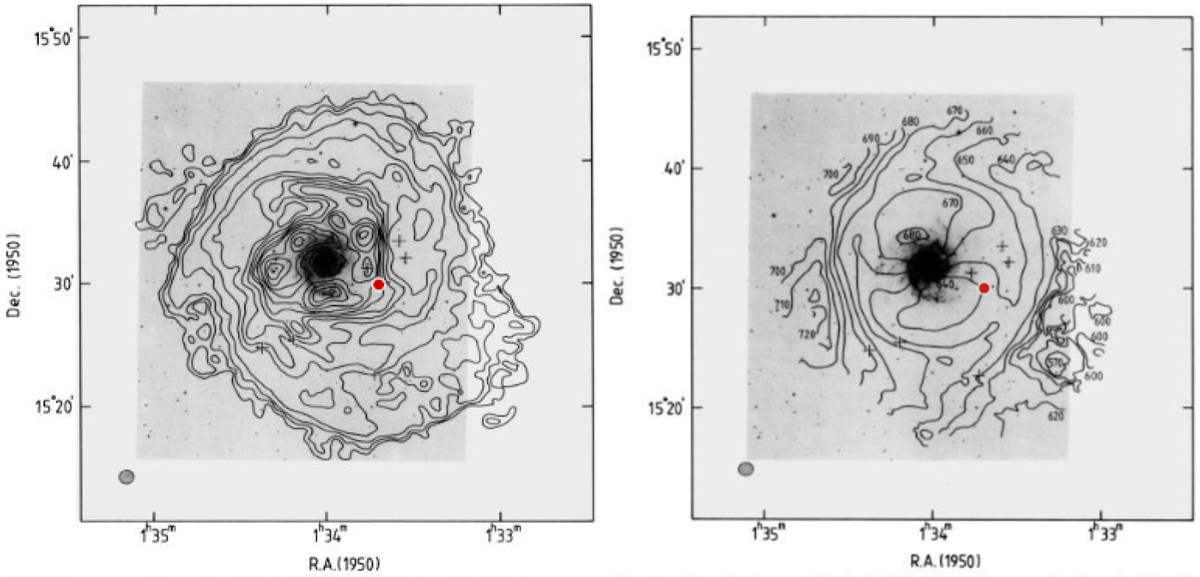
Low resolution HI map (the beam size of 72″ × 62″) superimposed on an optical image of M 74. The position of SN 2002ap is marked as the red dot (credit: Kamphuis & Briggs 1992, reproduced with permission © ESO). Left: zeroth moment map (integrated emission). Right: first moment map (velocity fields). The asymmetric tail with an irregular velocity field is visible at the south-western outskirt of the atomic disc (around the position of RA = 1h33m20s, Dec = 15° 25m). North is up and east is to the left.
Current usage metrics show cumulative count of Article Views (full-text article views including HTML views, PDF and ePub downloads, according to the available data) and Abstracts Views on Vision4Press platform.
Data correspond to usage on the plateform after 2015. The current usage metrics is available 48-96 hours after online publication and is updated daily on week days.
Initial download of the metrics may take a while.