Fig. 2.
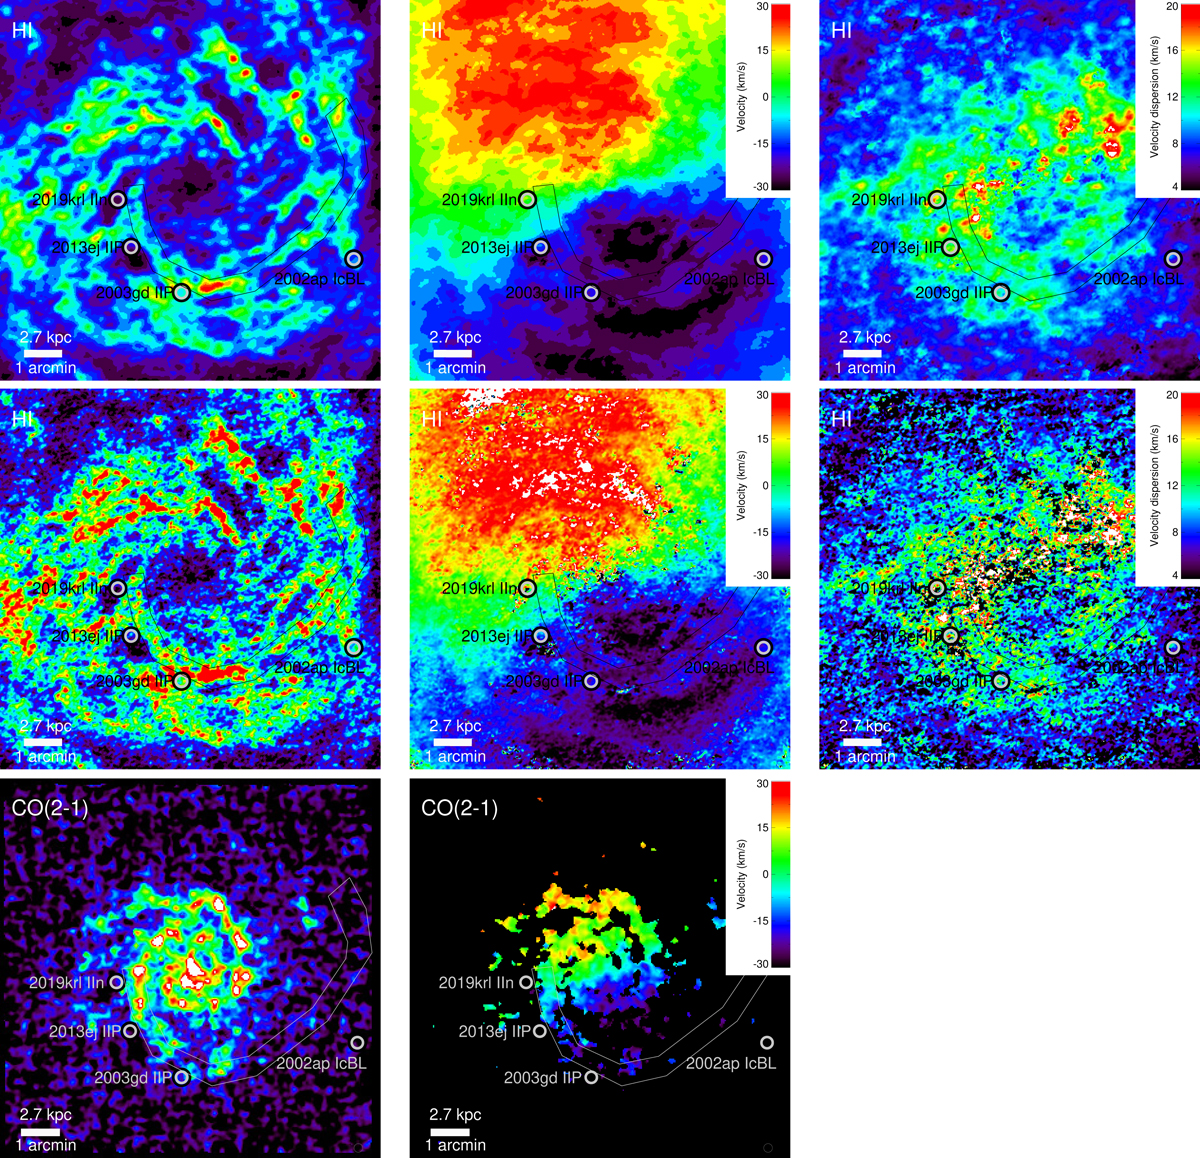
Gas distribution in M 74. Top and middle: HI data with a resolution of 11.9″ × 9.3″ and 6.9″ × 5.6″, respectively (Walter et al. 2008). Bottom: CO(2–1) data with a resolution of 13.4″ (Leroy et al. 2009). Left: zeroth moment maps (integrated emission). Middle: first moment maps (velocity fields) relative to z = 0.00219 (656.545 km s−1). Right: second moment maps (velocity dispersion). The positions of SNe are marked by grey circles. The lines outline the main spiral arm. Each panel is 10′ per side. North is up and east is to the left.
Current usage metrics show cumulative count of Article Views (full-text article views including HTML views, PDF and ePub downloads, according to the available data) and Abstracts Views on Vision4Press platform.
Data correspond to usage on the plateform after 2015. The current usage metrics is available 48-96 hours after online publication and is updated daily on week days.
Initial download of the metrics may take a while.