Fig. 8.
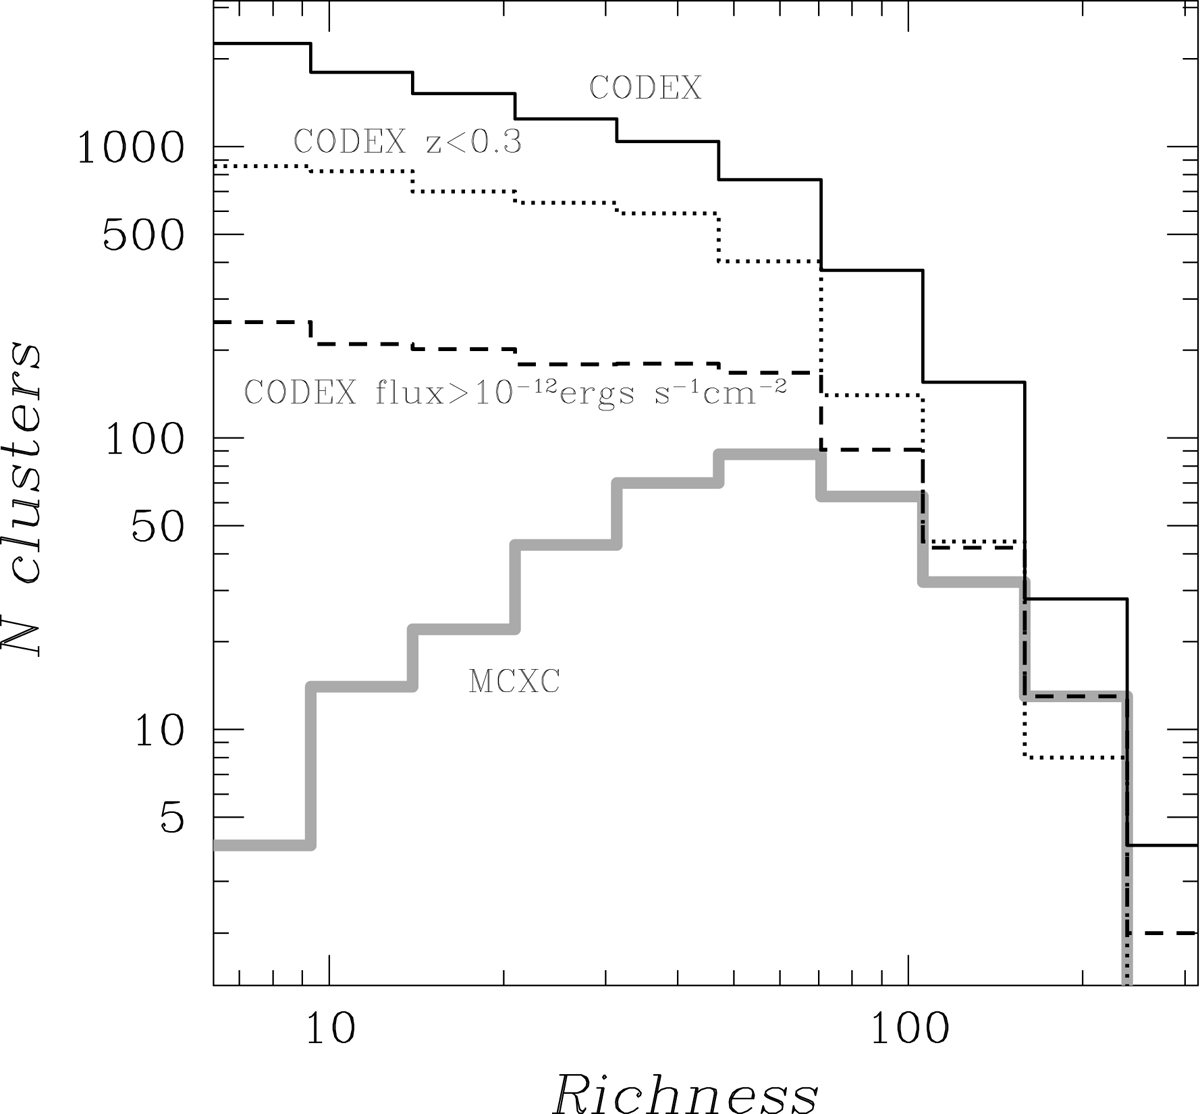
Richness distribution of CODEX clusters (solid black histogram) compared to a subsample of CODEX clusters with flux above 10−12 ergs cm−2 s−1 (dashed black histogram), z < 0.3 CODEX clusters (dotted black histogram), and the matched MCXC clusters (solid gray histogram). The comparison shows a deficiency in the low richness identifications present in the MCXC catalog.
Current usage metrics show cumulative count of Article Views (full-text article views including HTML views, PDF and ePub downloads, according to the available data) and Abstracts Views on Vision4Press platform.
Data correspond to usage on the plateform after 2015. The current usage metrics is available 48-96 hours after online publication and is updated daily on week days.
Initial download of the metrics may take a while.