Fig. 7.
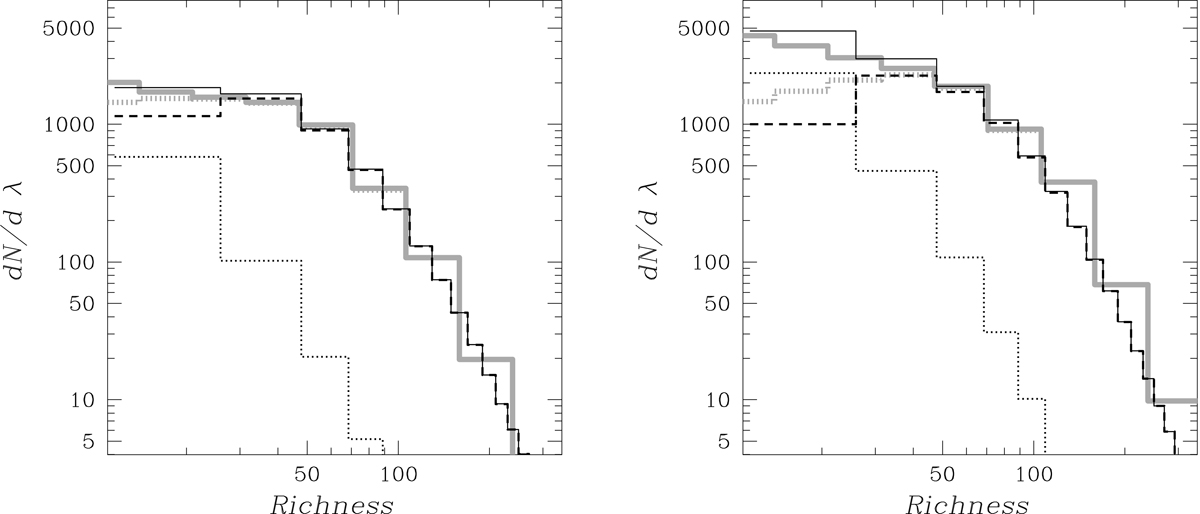
Richness function of CODEX clusters in the 0.1 < z < 0.3 (left panel) and 0.1 < z < 0.6 range (right panel). The solid gray histogram shows the data; the dotted histogram shows the contribution to the total counts from the clusters detected through their AGN activity; the dashed histogram shows the contribution from clusters detected through their thermal emission; and the solid histogram shows the total expected number of detection, which provides a good match to the data. The dotted gray histogram shows the data with excision of points deviating beyond the 2σ from the richness−LX relation.
Current usage metrics show cumulative count of Article Views (full-text article views including HTML views, PDF and ePub downloads, according to the available data) and Abstracts Views on Vision4Press platform.
Data correspond to usage on the plateform after 2015. The current usage metrics is available 48-96 hours after online publication and is updated daily on week days.
Initial download of the metrics may take a while.