Free Access
Fig. 6.
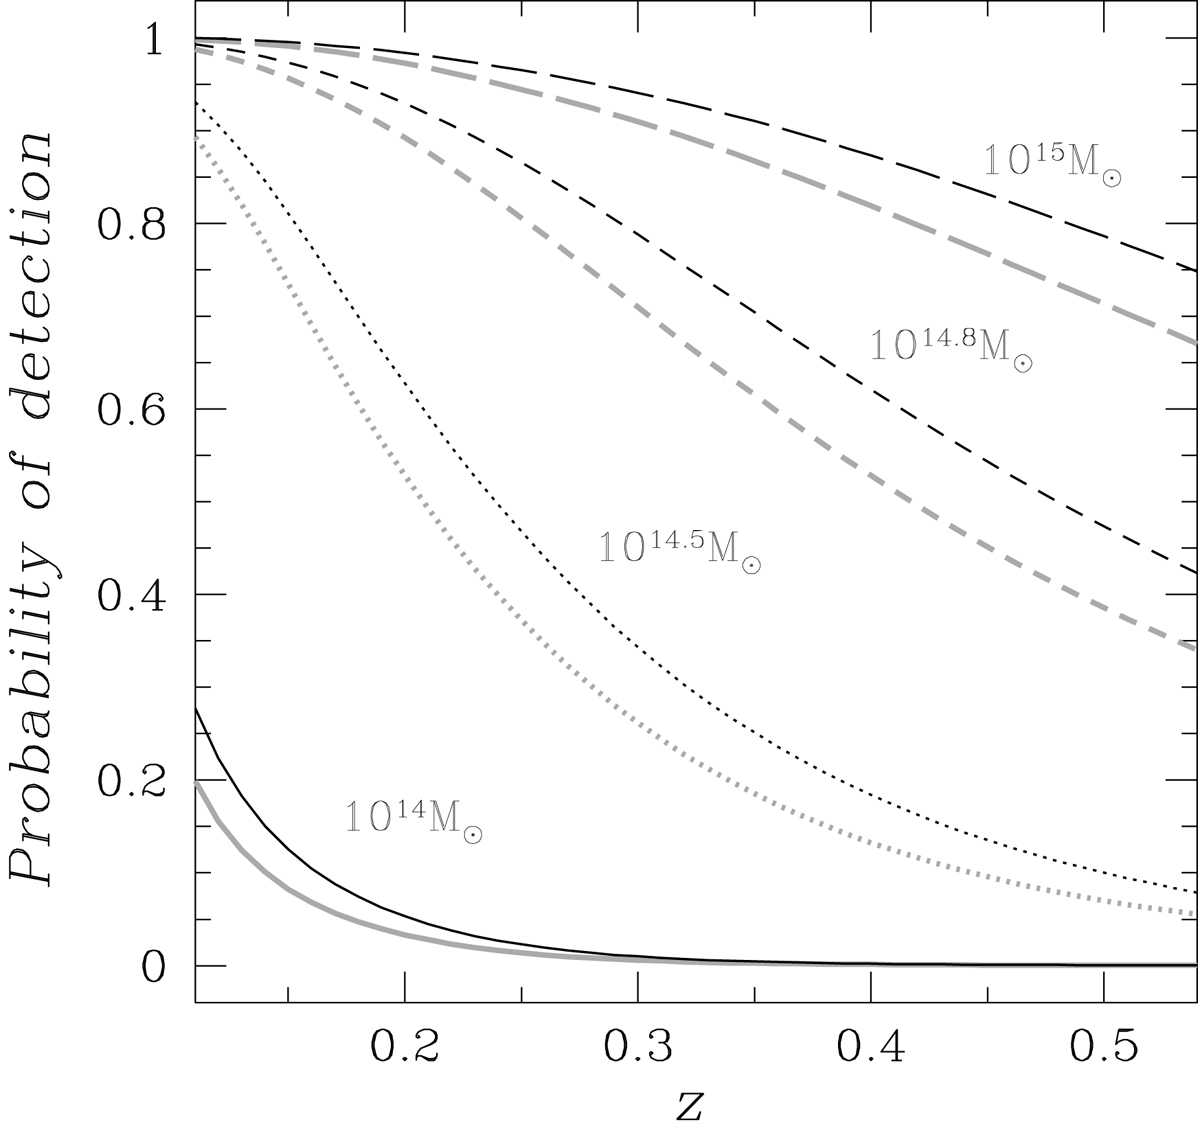
Probability of cluster detection as a function of redshift. The solid, dotted, dashed, and long-dashed curves denote the calculation for log10(M200c/M⊙) of 14, 14.5, 14.8, and 15, respectively. The gray curves show the same calculation for clusters with richness deviating from the mass-richness relation by +1.5σλ|μ.
Current usage metrics show cumulative count of Article Views (full-text article views including HTML views, PDF and ePub downloads, according to the available data) and Abstracts Views on Vision4Press platform.
Data correspond to usage on the plateform after 2015. The current usage metrics is available 48-96 hours after online publication and is updated daily on week days.
Initial download of the metrics may take a while.